Managing tempdb

This post is all about the tempdb database. It is not about capacity planning, like size or number of data files – there is plenty of info about that out there. Instead, this is about managing it, in the sense of changing initial file size, adding a file, removing a file etc. SSMS isn’t obvious for some of these things for the tempdb database, and for some things SSMS is flat out wrong.

I tested all operations on SQL server 2017 and SSMS 17.8.1.


Background

Tempdb is re-created at start-up. Or, rather re-initiated (in lack of better words). SQL Server do not delete the files and create new ones, that would take ages for large files if you don’t have Instant File Initialization (which you never have for log files). So how does SQL Server know what files to create, the logical and physical names, size etc? The answer is sys.master_files.


sys.master_files

This is the “template” information for the tempdb files. I will refer to sys.master_files as the template below (not to be confused with model which is template for other things, but not the file aspects of tempdb). Here you see how the tempdb files will be created/initialized at next start-up. Don’t confuse this with tempdb.sys.database_files, which show the current state for the tempdb files. Below two queries will show you the current state for the tempdb files and also the template state:

--Current
SELECT
'tempdb' AS db_name_
,file_id
,name
,physical_name
,size * 8/1024 AS size_MB
,type_desc
,CASE WHEN is_percent_growth = 1 THEN CAST(growth AS varchar(3)) + ' %' ELSE CAST(growth * 8/1024 AS varchar(10)) + ' MB' END AS growth
,max_size * 8/1024 AS max_size_MB
FROM tempdb.sys.database_files
ORDER BY type, file_id

--Template
SELECT
DB_NAME(database_id) AS db_name_
,file_id
,name
,physical_name
,size * 8/1024 AS size_MB
,type_desc
,CASE WHEN is_percent_growth = 1 THEN CAST(growth AS varchar(3)) + ' %' ELSE CAST(growth * 8/1024 AS varchar(10)) + ' MB' END AS growth
,max_size * 8/1024 AS max_size_MB
FROM master.sys.master_files
WHERE DB_NAME(database_id)  = 'tempdb'
ORDER BY db_name_, type, file_id


Increasing current and template file size to larger than what it currently is

This is pretty straight-forward, both using T-SQL directly and also using SSMS. Here’s what it looks like in SSMS:

(The word “Initial” for the header “Initial Size (MB)” is pure nonsense. What you see is the current file size, picked up from sys.database_files. I am happy to see that the word “Initial” is removed in SSMS 18.0.)

To increase the file size you just type the desired, larger, size for the tempdb file. The T-SQL command to do this is also very straight forward, example:

ALTER DATABASE tempdb 
 MODIFY FILE ( NAME = N'tempdev', SIZE = 5GB )

ALTER DATABASE tempdb 
 MODIFY FILE ( NAME = N'temp2', SIZE = 5GB )

Note that SSMS will generate the file size in KB fpr the T-SQL command, but the T-SQL command accepts KB, MB, GB and even TB.

This operation increases the current file size as well as the template size.


Decreasing current file size

To reduce the current size, you can attempt a shrink operation, for instance using such as below T-SQL command:

USE tempdb
DBCC SHRINKFILE(tempdev, 100)

The second parameter is the desired size in MB. This will change the current size as well as the template size. In my experience, you should be prepared for a limited success to do shrink file a tempdb file reducing the current size. In many cases, you will have to re-start SQL Server so it will be created with the template size. Or, hunt down whatever is using it and take it from there.


Changing template file size to smaller than what it currently is

One way is to change the size in the GUI to a smaller size and it will try to make the current size smaller as well as change the template size. If you don’t want to perform the shrink operation, then specify a larger size than the current size, script the command to a T-SQL query window and in there just specify whatever size you want. It will generate a command such as:

ALTER DATABASE tempdb 
 MODIFY FILE ( NAME = N'tempdev', SIZE = 100MB )

If the specified size is smaller than the current file size, then it will only change the template, not the current size.


Adding file

This is dead-easy. In SSMS, just press the “Add” button and specify the desired name, size etc. This will generate T-SQL such as:

ALTER DATABASE tempdb 
 ADD FILE ( NAME = N'tempdb3', FILENAME = N'R:\SqlData\a\tempdb_mssql_3.ndf' , SIZE = 5GB , FILEGROWTH = 200MB )

This will add it immediately and also to the template (both sys.database_files and sys.master_files).


Remove file

This is simple enough if the file is empty. In SSMS you select the file and press the “Remove” button.  It will generate T-SQL such as:

ALTER DATABASE tempdb 
 REMOVE FILE tempdb3

But if the file is current used you will get an error message and nothing was changed: not the current state, nor the template.

You can always attempt to shrink first using the EMPTYFILE option:

USE tempdb
DBCC SHRINKFILE(tempdb3, EMPTYFILE)

If you’re lucky, then the file was emptied and you can now use the ALTER command with the REMOVE FILE option. If not, then you are back to where you started.

You can try to re-start SQL Server and see if that allow you to remove the file. If not, then perhaps using the “failsafe” startup switch: /f (see Erin Stellato’s blog about this: https://www.sqlskills.com/blogs/erin/remove-files-from-tempdb/ ). Not be connected from SSMS when executing the commands might also help.


Changing other file attributes

If you want to change things like autogrow or maxsize, then just use SSMS or T-SQL directly. Here’s an example T-SQL command to change both autogrow and maxsize:

ALTER DATABASE tempdb 
 MODIFY FILE ( NAME = N'tempdev', MAXSIZE = 500GB , FILEGROWTH = 500MB )


Moving a file

This operation requires a re-start. SSMS doesn’t allow you to do this, so use T-SQL directly, such as:

ALTER DATABASE tempdb 
 MODIFY FILE (NAME = tempdev, FILENAME = 'R:\SqlData\b\tempdb.mdf')

Warning: Henrik reminded me in the comments section to add a warning here. “Make sure that R:\SqlData\b is present and that SQL Server has sufficient rights to create files here!” He is of course correct. In worst case you end up with SQL Server refusing to start if it cannot create tempdb where you have specified. In such case you can try the -f startup switch, perhaps a topic for another blog post.

Now, this is a sneaky one. It does change both sys.database_files and sys.master_files. So, looking only at the catalog views, you will be fooled that the file was moved immediately. But that didn’t happen, check the disk. Fortunately, the command comes with a message such as:

The file "tempdev" has been modified in the system catalog.
The new path will be used the next time the database is started.

That makes it pretty obvious. Note that the old file will not be removed when you restart your SQL Server. Go delete that file, after verifying that the new file was indeed created (if the “old” one is still the current one, then you won’t be able to delete it as long as SQL Server is running).


Summary

Managing tempdb isn’t that hard. As soon as you understand that we have the current state (tempdb.sys.master_files) and the template (sys.master_files), it is easier to understand. And, yes, SSMS is a bit quirky for these operations. The reason, methinks, is that it uses the same GUI as for other databases, which doesn’t have the aspect of a “template”.

Did I miss any operation? Let me know and I’ll might add it.
 

Bug in SSMS when using Extended Events

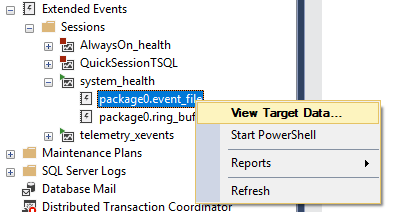
I’d like to share one bug that has been irritating me over a long time. It is very easy to handle, once you know what the problem is. I’ve seen it when I want to open a file XE target:

Here’s the relevant text in the message box, to facilitate searching:

The storage failed to initialize using the provided parameters. (Microsoft.SqlServer.XEventStorage)

Cannot view the function ‘fn_MSXe_read_event_stream’, because it does not exist or you do not have permission. (Microsoft SQL Server, Error: 15151)

The problem is that Object Explorer in SSMS tries to use that function from the current database, not the master database (where the function exists, so to speak). So the solution is to open Object Explorer making sure that the current database for Object Explorer is the master database.

This bug has been reported on UserVoice, April 2016. Go vote for it if you want to add your voice: https://feedback.azure.com/forums/908035-sql-server/suggestions/32902330-cannot-view-the-function-fn-msxe-read-event-strea


Tips for getting started with Extended Events

I know, I know. New habits are hard to learn. Many of us have been using SQL trace and the Profiler GUI for a very long time. And we know that we are supposed to move over to Extended Events (XE), but we postpone it for some later time. And then we give XE a try, and some thing doesn’t work as we want. So we go back to more familiar territories.

But XE has really grown on me over the last few years. I like to share the things that I initially didn’t like with XE, and how I overcame them. And also some other of my tips to make it easier to be productive with XE. I will deliberately minimize showing T-SQL and queries against the XE dynamic management views here. As you use XE more and more, you will probably use T-SQL to a higher degree. But this blog post is for those of you who want to “get into” XE and I find using a GUI is great as a starting point. Assuming the GUI is any good, that is. And I think the SSMS GUI is, for most parts.

Don’t use the ring buffer as target

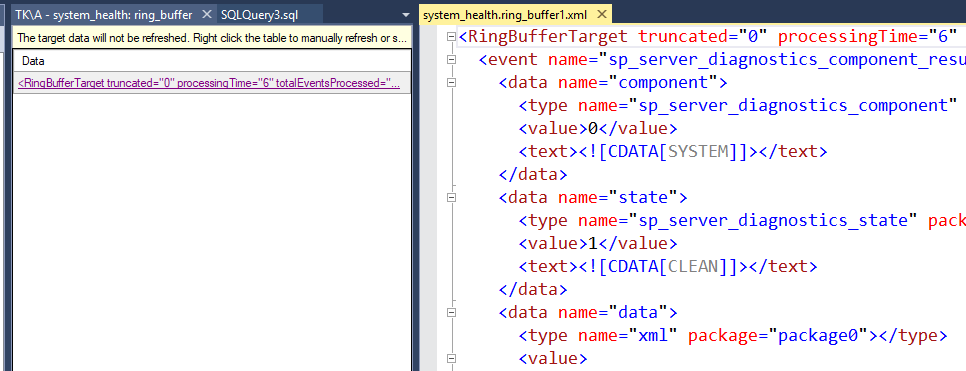
This is possibly the single most important thing to remember. Some would argue that the limitation for the DMV where you read the data is limited to 4 MB as the reason, and I can appreciate that. But more important is that SSMS won’t parse the data for you. XE is XML based, meaning that when you look at the XE data you get XML. And SSMS does nothing to help you for the ring buffer. It will just show the XML as is!


To the left you have what SSMS show you for the ring buffer and to the right you see what you get when you click the hyperlinked XML: the raw XML.

Use the file as target

So the obvious target would then be to use a file instead:

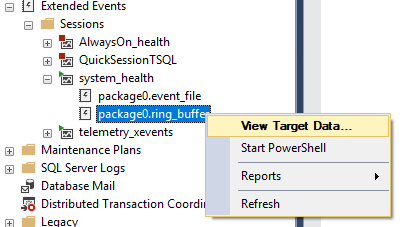
Note that the wizard to create event session defaults to the ring buffer. So, if you use the wizard, you probably want to change that to a file instead.

Use the targets instead of “watch live data”

Sure, sometimes you want to see things rolling by, as they happens. But saving to a target and looking at that target instead of the live data is more powerful. See the section about sorting etc below.

Show fields as columns

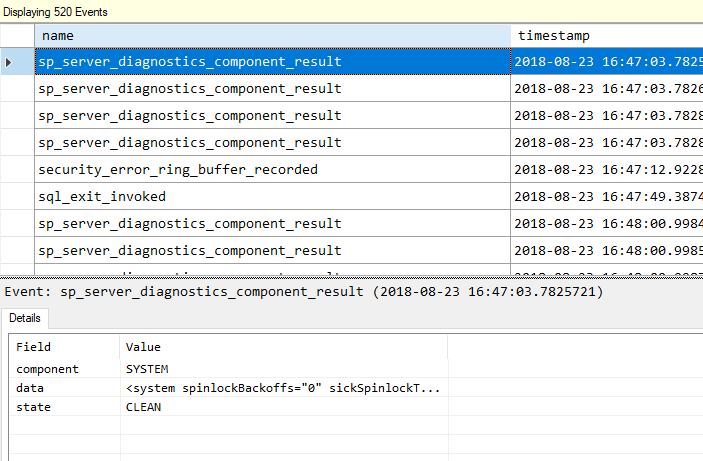
Bu default SSMS only show the name and timestamp fields. But all you have to do is to right-click in a filed at the lower half and select to show that as a column.

Explore sorting, grouping and aggregations

For this you need to look at a trace target, not the live window (except for filtering), but you can display a target even if the trace is currently running. Then just explore and find out that you can easily sort, group and aggregate the data:

Use SSMS to explore events, columns, etc

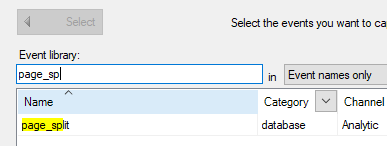
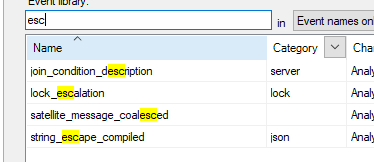
There are so many things you can capture with XE. But it can also be a but daunting. In my SQL Server 2017 instance, I have 1511 events. Compare that to the 180 you have for the old trace engine! So, XE is definitely richer, but you probably won’t browse through all 1500 events to find whichever could be interesting for the task at hand. So, create an event session using either the wizard to the “real GUI”. Just type letters and the GUI will filter on those, as you type:

Don’t expect events etc to be documented

For the old trace engine, we could read about all events and columns in Books Online. The “documentation” for the XE objects is instead in the DMVs, like for instance sys.dm_xe_objects has a “description” column. You don’t have to use these DMVs directly, though. Follow my above advice and SSMS will pick up those descriptions for you:

Use the “XEvent Profiler” that was added in SSMS 17.3

MS has probably noticed that there is a hesitation to pickup on XE. In SSMS 17.3, they added the XEvent Profiler in SSMS. This is just a quick way to start an XE session with a live data window. Nothing fancy, really, but having it in the “root” of SSMS makes it very snappy to kick of that trace quickly. And you can also customize it. See my earlier blog-post on this.

Explore other targets

The Wizard only allow you to select from two target. The dreaded ring buffer and the file target. But there are other interesting targets. Like histogram, to for instance show how many SQL commands were submitted for each database. Or the event_counter which just counts how any of each events occurred, for instance how many attentions, deadlocks and log escalations have we had. There are other targets as well!

Watch out for that latency

By default you can wait 30 second after an event happened until it has been delivered to the target(s). This is fine for a trace that you run into a target and analyze that target later. But when you want to do something interactively it feels like ages. I’m thinking of the “watch live data” functionality. The Wizard doesn’t let you specify the value for the MAX_DISPATCH_LATENCY parameter (of the CREATE EVENT SESSION command). So, use the “real GUI” or just script for the wizard and add that parameter. Of course, the shorter latency, the higher overhead. So, use with care.

Note that filters and actions are added per event

You can for most cases think of actions as “extra columns” you want to add. Anyhow, XE is flexible in many ways. For instance you might want to filter one event on something, and some other event on something else. Or accept the overhead of collecting one action for one event but not the other. But the wizard doesn’t work this way. The filtering and actions you specify will be applied for all events in the trace. You can of course script from the wizard and modify that script. But the “real GUI” os more true in the sense that you specify filter and actions for each event.

Don’t be afraid to use T-SQL

You can of course automate and customize enormously when you start using T-SQL to a higher degree. As usual, you can script things in SSMS that can serve as a great starting point. Below is an example of a query that “parses” the XML for a ring buffer trace into columns in the result set:

SELECT 
event_data.value('(@name)[1]', 'varchar(50)') AS event_name
,event_data.value('(@timestamp)[1]', 'datetime2(0)') AS time_stamp
,event_data.value('(data[@name="statement"]/value)[1]','nvarchar(50)') AS statement_
,event_data.value('(data[@name="duration"]/value)[1]','bigint') / 1000 AS duration_ms
,event_data.value('(data[@name="cpu_time"]/value)[1]','bigint') /1000 AS cpu_ms
,event_data.value('(data[@name="logical_reads"]/value)[1]','bigint') AS logical_reads
,event_data.value('(data[@name="physical_reads"]/value)[1]','bigint') AS physical_reads
,event_data.value('(data[@name="row_count"]/value)[1]','bigint') AS row_count
,event_data.value('(action[@name="database_name"]/value)[1]','nvarchar(128)') AS database_name_
FROM #myXeData AS evts
CROSS APPLY StatementData.nodes('//RingBufferTarget/event') AS XEventData(event_data)
--ORDER BY time_stamp
ORDER BY duration_ms DESC

Note that I have saved the trace into a temp table. If you don’t, those XQuery operations will take ages.

Etc

I feel I could go on and on. But I’ll stop here. I might add something at a later time, if I come to think of something obvious. Feel free to add your tips in the comments.

Explaining Activity Monitor

This post is not about how to use the Activity Monitor (AM) tool in SQL Server Management Studio (SSMS) – there are loads of such posts written already. Also, it is not about dissing AM, you will find such posts as well.

What I want to do is to explain the information in AM, for instance what time span the information covers. I see lots of confusion about this, and incorrect assumptions can be made because of that. This aspect is typically not mentioned in other blog posts on AM that I have seen.

The SQL Server documentation is very vague on the topic. In fact, the most recent documentation article explaining the information in AM that I found is for SQL Server 2008 R2. And that documentation is at many places vague, or even flat out incorrect. For more recent versions of SQL Server, there’s not even an attempt to explain the information. (Please let me know if you find such official articles.)

I know that lots of people uses the Activity Monitor tool in SQL Server, especially the less experienced DBA. The more experienced DBA often uses other tools like Adam Machanic‘s sp_whoisactive (see this and this) , Brent Ozar’s sp_BlitzFirst, etc.

Say for instance that you had massive amount of I/O for one of your databases for the last day, up until a minute ago. I.e., the I/O load for the database varies a bit, but on average is very high. You look in AM which show this database as silent since you happened to have low I/O the last minute, and AM show some other database as being the one with high load.

So, we need to think about the time dimension here. AM does a refresh at certain intervals. By default it is every 10 seconds, but you can change that by right-clicking somewhere in AM and change in that context menu. Keep this in mind. It is important. We will refer to it as the most recent refresh interval, or snapshot.

I’m using SQL Server Management Studio (SSMS) 2016, and SQL Server 2016. It is possible that other version combination does other things. With the information in this blog post, you will be able to find and determine that for yourself. Please comment if you find important deviations, or perhaps just confirmations (like “SSMS 2012 does the same thing”).

I mainly used tracing to spy on the SQL submitted by AM.

The four top graphs:

 
“% Processor Time” is picked up directly from the OS (using WMI, I believe). Most probably a Performance Monitor counter in the end.


“Database I/O” is the sum of I/O for all database files performed since the last snapshot. This is fine since we intuitively understand that, because we have the trail of prior snapshot values displayed in the graph. The information comes from sys.dm_io_virtual_file_stats, doing a SUM over num_of_bytes_read + num_of_bytes_written, converted to MB.


“Batch Requests/sec”
 is the number of batches we have submitted to our SQL Server since the last snapshot. Again, this is pretty intuitive since we have a trail of snapshot values in the graph. The information is from the performance counter “Batch Requests/sec” picked up from sys.sysperfinfo (bad Microsoft, you should use sys.dm_os_performance_counters 🙂 ).


“Waiting Tasks”
 show how many that are waiting for something (a lock to be released, for instance). This is not as straight-forward as the others. The information comes from sys.dm_os_wait_stats UNION ALL with sys.dm_os_waiting_tasks.

The values are compared to those from the prior snapshot. However, a higher weight in that calculation will be given to the prior snapshot values if you have a short refresh interval. Say that you have a 1-second refresh interval. Then only a weight of 9% is from the current interval and 91% is from the prior interval. Since the current interval value will become the prior value for the next snapshot, a “trail” is kept back in time with a diminishing weight the longer back in time you go.

If you refresh every 10 seconds, then current interval weight is 60% and previous interval weight is 40%. It pretty quickly approaches 100% for current snapshot the longer refresh interval you are using. Hats off to Microsoft for so clearly documenting this in the temporary stored procedures that AM is using. It is in the source code, all you need to do is to grab it in a trace and read it. The name of the procedure is #am_generate_waitstats, and it is created when you open the AM window in SSMS.

Note that not all wait types are represented here. See the section below named ‘The “Resource Waits” pane’ for more information. The “Waiting Tasks” diagram and the “Resource Waits” pane shares some T-SQL code.

The “Processes” pane
This is pretty straight forward so I won’t spend much time on it here. It shows information about the sessions you have at the moment the snapshot is produced. It uses a query joining DMVs such as sys.dm_exec_sessions, sys.dm_exec_requests, sys.dm_os_tasks, etc. Go grab the query in a trace and paste into a query window if you want to dig into it.

The “Resource Waits” pane
The idea here is to show where SQL Server is waiting, “wait stats”.

It uses the same procedure as the “Waiting Tasks” diagram uses, #am_generate_waitstats, to get the information. See the above section for “Waiting Tasks” to understand the time dimension for this. For simplicity, we can say that it shows only wait stats for the past 30-60 seconds. This is important. Imagine that you had loads of a certain wait stats, but none just for the last minute. This pane can now fool you that you didn’t have any waits of that kind, just because you didn’t for the past minute. Note, though, that the “Cumulative Wait Time” column is the sum of wait in the group since SQL Server was re-started or since we last cleared the wait state (DBCC SQLPERF(“sys.dm_os_wait_stats”,CLEAR)).

In an attempt to be friendly, it will group and summarize wait stats into various groups. That would be fine if there were some documentation about which individual wait type is in each group. Also, some wait types are ignored. One of the ignored wait types is CXPACKET, another is THREADPOOL.

AM creates a table named #am_wait_types when you open the AM window, which it populates with various wait types and the group each wait stats is in. This table has a column named “ignore”. The two wait types I mentioned above has 1 in this “ignore” column. There are 35 rows which has 1 for the “ignore” column. To be fair, most are benign but the two which I immediately reacted on are the ones I mentioned above.

But hang on, how many rows do we have in this #am_wait_types table in total?  The answer is 263. Are there more than 263 wait types in 2016? You bet! I did a select from sys.dm_os_wait_stats and I got 875 rows. So, 633 of the wait types in 2016 are not at all considered by AM. That of course begs the question whether I found any interesting wait types that aren’t in #am_wait_types? I didn’t go through them all, but I glanced only quickly and for instance SOS_SCHEDULER_YIELD caught my attention. If you want to go through them, then I highly recommend Paul Randal’s wait types library. If you find anything that stands out, then please post a comment.

SELECT ws.wait_type FROM sys.dm_os_wait_stats AS ws
WHERE ws.wait_type NOT IN(
SELECT wt.wait_type FROM #am_wait_types AS wt WHERE wt.ignore = 0
)
ORDER BY wait_type

The “Data File I/O” pane
This shows I/O activity per database file since the last snapshot. Again, you could for instance have had lots of I/O for a database the last day, but if it was silent the past minute, then this dialog will potentially mislead you.

The “Recent Expensive Queries” pane
This shows the most expensive queries, based on what column you sort on, executed since the last snapshot. If you have, say, a 10 second snapshot interval, you will only see the queries executed during these 10 seconds. AM uses a procedure named #am_get_querystats to collect the information. There are a few things going on inside this procedure, but at the most basic level, it uses sys.dm_exec_query_stats and sys.dm_exec_requests to get queries from cache and currently executing queries. It then does some processing and store the result in temp tables so we later can sort on different columns depending on what metric we are interested in. I suggest that you spend some time with the source code if you want to dig deeper.

The “Active Expensive Queries” pane
This is very straight forward. It executes a query which uses sys.dm_exec_requests joined to a few other DMVs.

How to dig deeper
I thought about including snippets of AM’s source code, the list of wait stats grouping etc here. But I decided against that. It would litter this post, and the code might differ between releases and builds of SSMS. So, if you are interested in digging deeper, fire up your favorite trace tool (Extended Events, Profiler, Server-side trace, …) and catch the SQL submitted by AM.

When you open the AM window, it executes a few batches that creates procedures and tables that it will later use for each refresh interval. Here are the ones that I found:

  • The table #am_wait_types, which contains the wait types that AM bothers about, along with the grouping and which of those that are ignored. This is the one you want to investigate to see which wait types that are ignores by AM; either having 1 in the “ignore” column, or by not being in that table in the first place. Match against sys.dm_os_wait_stats.
  • The procedure #am_generate_waitstats which collects wait stats with some trail back in time, as explained above.
  • The table #am_dbfileio in which file I/O stats is stored.
  • The tables #am_request_countand and #am_fingerprint_stats_snapshots, used for query statistics.
  • The procedure #am_get_querystats, which collects and stores the query statistics.

At each refresh interval, you see 4 T-SQL batches submitted for the top 3 graphs that are T-SQL based (ignoring the “dead” graph that I have in SSMS 2016, and also ignoring “% Processor Time” since it is WMI-based).

If you have expanded the “Processes” pane, you also see a batch that collects that information at every refresh interval.

If you have expanded the “Resource waits” pane, you also see a batch that does a SELECT from the #am_resource_mon_snap table at every refresh interval, with grouping and SUM based on resource type.

If you have expanded the “Data File I/O” pane, you also see a batch that collects that information at every refresh interval.

If you have expanded the “Recent Expensive Queries” pane, you also see a batch that executes the #am_get_querystats procedure to collects that information. It is executed at refresh intervals, but not necessarily at every refresh interval. Check the source code for the procedure and you see that SM will execute this no more frequently than every 15 seconds.

If you have expanded the “Active Expensive Queries” pane, you also see a batch that executes a query to collects that information. It seems to be limited so it doesn’t execute more frequently than every 5 seconds (even with a shorter refresh interval).

The bottom line
As always, with understanding of the data we see, we have a chance to make information out of it. The Activity Monitor certainly has its quirks, but if you do feel like using a GUI for these type of things, I hope that you are better equipped now to interpret what it is you are seeing. Personally, I find “Resource Waits”, “Data File I/O” and “Recent Expensive Queries” less useful because of the time dimension handling. As for expensive queries, IMO nothing beats the Query Store in SQL Server 2016.

SSMS 17.3 has built-in Profiler

We all know that Profiler and its background functionality SQL Trace has been deprecated since 2012. Right?

And we have all switched to using Extended Events (XE), a long time ago, right?

No, the reality is that many of us still uses the old tracing infrastructure. This can be for various reasons, like:

  • Familiarity
  • Existing templates and stuff
  • Ease of use
  • Lack of functionality in the replacement


I have been gradually switching over to XE over the last few years. And I have been gradually becoming to like it more and more. It is a learning curve, for sure, but it is so superior and even the GUI is in my opinion more powerful if you are a) looking at a saved trace and b) use a trace file instead of the ring buffer. Just the ability to be able to sort, group and aggregate with a few clicks is for me great.

But enough about the general stuff, I’m actually going somewhere with this.

One functionally for which I haven’t been using XE much is to look at live data. I’m talking about scenarios such a “I wonder what happen when you press this button?”. Or, something I very frequently do is to look at the resource usage for SQL command from a trace instead of using commands such as SET STATISTICS IO ON. For these type of tasks, I often just fire up Profiler and use my own Profiler templates.

A very promising new functionality in SQL Server Manager Studio (SSMS) 17.3 is the new XE Profiler. This is a Profiler-like experience built-in to SSMS.

XE Profiler

Just double-click any of the two entries and you have a live trace window. This is built on the SSMS XE “Watch Live Data” functionality. There’s actually no magic going on here. What happens is that SSMS creates a trace session if it doesn’t exist, starts that session and opens a live data window for that trace session. There’s no target for the trace, live data doesn’t require a target. The event sessions that will be created are named:

  • Standard          QuickSessionStandard
  • TSQL               QuickSessionTSQL

The above corresponds to the Profiler templates with the same names. The really cool thing is that you can customize these sessions. I, for once, frequently want to see resource usage for queries. I modify QuickSessionTSQL to grab the completed events instead of the started events. Don’t worry if you mess it up – just delete the trace session and let SSMS re-create it for you next time you open a that Quick Session!

Here’s an example

IF EXISTS(SELECT * FROM sys.server_event_sessions WHERE name = 'QuickSessionTSQL')
DROP EVENT SESSION QuickSessionTSQL ON SERVER
GO
CREATE EVENT SESSION QuickSessionTSQL ON SERVER
ADD EVENT sqlserver.rpc_completed(
ACTION(sqlserver.client_app_name,sqlserver.database_id,sqlserver.database_name,sqlserver.server_principal_name,sqlserver.session_id)),
ADD EVENT sqlserver.sql_batch_completed(
ACTION(sqlserver.client_app_name,sqlserver.database_id,sqlserver.database_name,sqlserver.server_principal_name,sqlserver.session_id))
WITH (MAX_MEMORY=8192 KB, MAX_DISPATCH_LATENCY=5 SECONDS, MAX_EVENT_SIZE=0 KB, MEMORY_PARTITION_MODE=PER_CPU)

When you Launch Session then by default it will show the columns that was relevant for the session definitions that shipped with SSMS. What you might want to do is to re-configure the columns that is shown.

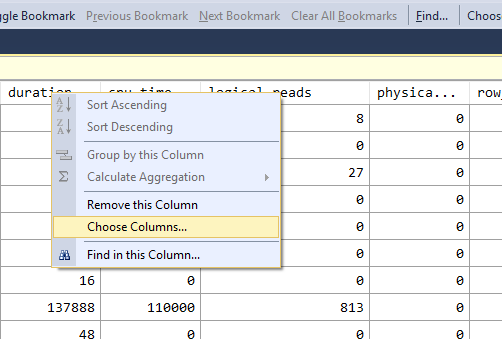
To remove a column: Right-click on the column header that you don’t want to see and remove that column.

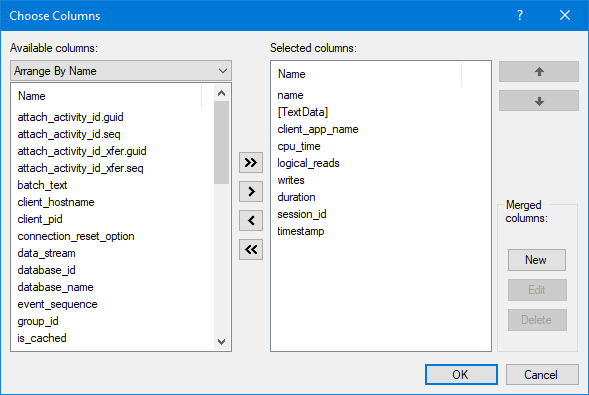
To add a column in the display: You can in the lower window, the “Details” section, right-click a field and “Show Column in Table”. Or you can in the column header in the top column header section right-click and “Choose Columns”.
Choose Columns 2Choose Columns

I might over time build some more “alternate” templates for XE Profiler, which I will add here.


July SSMS 2016 changes transaction semantics

This can be a very nasty one if you’re not observant. The July update of SSMS now has the option to change XACT_ABORT setting for a query window using

  • Tools
  • Options
  • Query Execution
  • SQL Server
  • Advanced
  • SET XACT_ABORT
Now, exposing one more SET option can’t be bad, right? But Erland Sommarskog found out that this is checked by default. Now, using XACT_ABORT might now be a bad thing, au contraire. See this one of Erland’s series of error handle articles.
The problem is that it is a change. Quite of a sudden, your transaction semantics isn’t the same, and if you execute that script from somewhere else, or even an older SSMS, it doesn’t behave the same. For instance, if you don’t use TRY CATCH (which you should be using), then the batch will now stop and rollback on most errors, instead of allowing you to do the old eighties style IF @@ERROR <> 0 dance.
Personally, I SET my set commands instead of checking a checkbox in SSMS. But I don’t SET all set options there are, just the ones I want to change from default. I hope that this one can be reverted so it isn’t checked by default.

Restoreability and SSMS

I have written about this before, how SSMS generates restore commands that will fail. This post is about showing what it might look like using screenshots. If you always use T-SQL directly to do restore, then you won’t be affected by this. But if you expect to be able to perform restore using the restore dialog, then read on.

The problem
The issue is that SSMS base a restore sequence on backups that are impossible to restore from. There are two cases I have found:

Copy only backups
The purpose of the COPY_ONLY option for the backup command is to do an out-of-bands backup. I.e., you do an ad-hoc backup as a one-time thing, restore this on your test server and then delete the backup file. The copy only option is for you to say that you don’t want to affect your scheduled backups with this ad-hoc backup. We expect SSMS to not base the restore sequence on these backups – since it is likely that the backup file has been deleted.

Snapshot backups
If you perform a snapshot of a virtual machine (or “checkpoint” as Hyper-V calls it) then this snapshot might interact with VSS in Windows so you get a consistent state of your SQL Server databases. I.e., when you restore/apply such a snapshot, your databases should be just fine. This is great, as long as it doesn’t mess up the SQL Server backups that we produce. It won’t. But the restore GUI in SSMS can be messed up by such a snapshot.

The timeline dialog
The problem seems to occur in the timeline dialog. In the restore GUI, there’s a nifty timeline dialog where you can use a slider to graphically specify at what point in time you want to restore the database to. The GUI uses the backup history information in msdb and based on that figures out what restore operations to perform. This is actually really nice and friendly. As long as it works. The problem is when you specify an earlier point in time, it sometimes uses the incorrect full backup – a full backup which isn’t possible to restore from.

Examples:

RestoreabilityCopyOnlyOK.PNG

Above, the GUI correctly skips a copy only backup. A full copy only backup was produced after the full backup listed above, but the GUI is smart enough to not base the restore sequence on this copy only backup. This is how it should work.

RestoreabilityTimeline

RestoreabilityCopyOnlyNotOK

Above, the GUI incorrectly base the restore on a copy only backup. After using the timeline dialog to point to an earlier point in time, you can see that the GUI now has changed so it bases the restore on this potentially non-existing copy only backup. Not a nice situation to be in if the person doing the restore hasn’t practiced using the T-SQL RESTORE commands.

RestoreabilitySnapOK

Above, the GUI correctly skips a snapshot backup. A snapshot backup using VSS was produced after the full backup listed above, but the GUI is smart enough to not base the restore sequence on this snapshot backup. This is how it should work.

RestoreabilitySnapNotOK.PNG

RestoreabilitySnapNotOKTSQL

Above, the GUI incorrectly base the restore on a snapshot backup. After using the timeline dialog to point to an earlier point in time, you can see that the GUI now has changed so it bases the restore on the snapshot backup. This is immensely bad since the snapshot doesn’t exist in SQL Server. It is just a placeholder so that SQL Server is aware that a snapshot was performed at that point in time. Look at the RESTORE command it produces!

You might wonder how to tell if something is producing VSS snapshots of your machine? You can see that in the errorlog file. Here are a few lines from the errorlog on a machine where I used Hyper-V to produce a proper VSS snapshot (edited for readability):

2016-03-16 13:30:23.75      I/O is frozen on database Adventureworks2014.
2016-03-16 13:30:23.75      I/O is frozen on database theBackupTestTib.
2016-03-16 13:30:23.75      I/O is frozen on database master.
2016-03-16 13:30:29.33      I/O was resumed on database master.
2016-03-16 13:30:29.33      I/O was resumed on database theBackupTestTib.
2016-03-16 13:30:29.34      I/O was resumed on database Adventureworks2014.

Bottom line
You already know this. Practice doing restores – as realistically as possible and using different scenarios.

Disclaimer: Things might change. The tests I did was using SSMS 2014 for the copy only backups and for SSMS 2016 CTP 3.3 for snapshot backups. I have seen this behaviour since SQL Server 2012, though. I wish that this will be fixed in a future version of SSMS, but considering that my requests has gone unnoticed before, I don’t have much hopes. But if you do see something different, let me know and I can re-test. Just make sure to add as much details as possible.

I used my stored procedure at found here to perform the backups – made the T-SQL used for these tests a bit easier to read:

--Show that restore based on backup history idn't possible
--is the most recent full backup is missing, even if COPY_ONLY was used.

--Create the BackupDbWithTs procedure first:
--http://www.karaszi.com/sqlserver/util_backup_script_like_MP.asp

--We will do full backups, diff backups and log backups.
--In between, we will also do a COPY_ONLY full backup (think of it as an ad-hos backup subsequentially deleted).

---------------------------------------------------------------------------------------------
--Drop and create the test database
--NOTE: This will drop a database named theBackupTestTib is such exists!!!!
---------------------------------------------------------------------------------------------
IF DB_ID('theBackupTestTib') IS NOT NULL
DROP DATABASE theBackupTestTib
GO

CREATE DATABASE theBackupTestTib
GO

--Set to full recovery
ALTER DATABASE theBackupTestTib SET RECOVERY FULL
GO

---------------------------------------------------------------------------------------------
--Create a table so we can make a modification in the database between each backup
---------------------------------------------------------------------------------------------
IF OBJECT_ID('theBackupTestTib.dbo.t') IS NOT NULL DROP TABLE theBackupTestTib.dbo.t
GO

CREATE TABLE theBackupTestTib.dbo.t(c1 INT IDENTITY, c2 CHAR(30) DEFAULT 'Hello backup world')
GO

---------------------------------------------------------------------------------------------
--Declare and set variables.
--Adjust to your liking.
DECLARE
@i INT = 1
,@time_in_between VARCHAR(20) = '00:01:00'    --Time between each backup. 1 sec is fine to test thet restore GUI work.
--Set to higher if you want to use the timeline restore dialog and visually see your backups.
,@iterations INT = 2                      --Number of iterations. Adjust as you wish, but do at least two.
,@db SYSNAME = 'theBackupTestTib'
,@path VARCHAR(200) = 'R:\'                   --Where to put your backup files. Delete backup files after you are finished.

WHILE @i <= @iterations
BEGIN
INSERT INTO theBackupTestTib.dbo.t  DEFAULT VALUES;

EXEC MASTER..BackupDbWithTs @db, @path, 'FULL', 'N', 'N', 'N'; INSERT INTO theBackupTestTib.dbo.t DEFAULT VALUES; WAITFOR DELAY @time_in_between
EXEC MASTER..BackupDbWithTs @db, @path, 'LOG ', 'N', 'N', 'N'; INSERT INTO theBackupTestTib.dbo.t DEFAULT VALUES; WAITFOR DELAY @time_in_between

--Perform the COPY_ONLY or snapshot backup now:
EXEC MASTER..BackupDbWithTs @db, @path, 'FULL', 'N', 'N', 'Y'; INSERT INTO theBackupTestTib.dbo.t DEFAULT VALUES; WAITFOR DELAY @time_in_between --COPY_ONLY

EXEC MASTER..BackupDbWithTs @db, @path, 'DIFF', 'N', 'N', 'N'; INSERT INTO theBackupTestTib.dbo.t DEFAULT VALUES; WAITFOR DELAY @time_in_between
EXEC MASTER..BackupDbWithTs @db, @path, 'LOG ', 'N', 'N', 'N'; INSERT INTO theBackupTestTib.dbo.t DEFAULT VALUES; WAITFOR DELAY @time_in_between
EXEC MASTER..BackupDbWithTs @db, @path, 'LOG ', 'N', 'N', 'N'; WAITFOR DELAY @time_in_between

SET @i = @i + 1
END

Can you restore from your backups? Are you sure?


A few days ago, we were doing restore practice drills with a client. I had tested the stuff before this, so the practice was more for the client’s DBAs to test various restore scenarios, with me being able to point to the right direction (when needed), supplement the run-book and stuff like that. Always fun, I like these drills!

Anyhow, This client does regular SQL Server backups to disk (full, and for some databases also log) at 19:00. They also snap the machines every night at 04:00. We don’t want to have dependencies on the machine snap, but it is nice to have in case a machine it totaled and we now can restore from such a snapshot. The issue is that this machine snapshot is seen as a full backup by SQL Server. We all know that a full backup do not affect the log backup chain, but the restore GUI doesn’t care about that!

So the restore GUI suggest that you restore from 04:00 full backup (which isn’t a restoreable backup as it was a snapshot) and then the subsequent log backups. What we need to do is to restore from earlier 19:00 full backup, and then all log backups – ignoring the 04:00 snapshot backup.

Fortunately, my client by themselves (without my intervention) did the restore using T-SQL commands, knowing what backup exists, and figuring out what to restore. But I also wanted them to test the GUI, just so they know how that look like. Of course, you can do a restore from 19:00 to 03:55, and script that to a query window. Then then from 04:00 to current time (or whatever) and script that too,. And then stitch these together. But just typing (with some copy-paste) the commands are much easier.

My point? Test your restores. Do not expect anything. A production situation is not the right time to try to figure these things and trying to cope with it.

About this snapshot software: The next version is expected to have an option to produce the snapshot as a COPY_ONLY backup. Isn’t that great? Now we expect the restore GUI to skip this COPY_ONLY backup, right? No, that was not that I saw. Having an option to produce the backup as COPY_ONLY finally allow us to implement differential backups, but it (from my tests) won’t help with the restore GUI issues. Btw, here is a related post.

Here’s a query that might be helpful if you want to see what type of backups are produced. (I appreciate feedback from anybody if you can see if a snapshot backup sets 1 in the is_snapshot column – I don’t have environment to test at the moment…)


SELECT TOP(100)
database_name
,CASE bs.TYPE
WHEN 'D' THEN 'Full'
WHEN 'I' THEN 'Differential'
WHEN 'L' THEN 'Log'
WHEN 'F' THEN 'File or filegroup'
WHEN 'G' THEN 'Differential file '
WHEN 'P' THEN 'Partial'
WHEN 'Q' THEN 'Differential partial'
END AS backup_type
,bs.is_copy_only
,bs.is_snapshot
,DATEDIFF(SECOND, bs.backup_start_date, bs.backup_finish_date) AS backup_time_sec
,mf.physical_device_name
,bs.database_name
FROM msdb.dbo.backupset AS bs
INNER JOIN msdb.dbo.backupmediafamily AS mf ON bs.media_set_id = mf.media_set_id
ORDER BY backup_finish_date DESC;


Express Edition revisited, focus on SSMS

(Note: I have re-written parts of this post in the light of the comments that SP1 of 2012 include Complete tools.)

I have decided to revisit the topic of whats included in Express Edition, with focus on the tools. I have a couple of reasons for this:

  • In my 2011 post, I never tried to connect from Express SSMS to a non-Express database engine.
  • I want to check if there are any significant differences in SQL Server 2012 Express Edition, compared to SQL Server 2008R2 Express Edition.

It isn’t uncommon that people want to have SQL Server Management Studio (SSMS) on their machines; and instead of searching for the install files for the full product, they download the freely available Express Edition and install SSMS from there. This was the main reason for this update post, and the reason I focus on SSMS and the tools in this post.

It turns out that both 2008R2 and 2012 RTM Express editions of SSMS includes a lot, but not quite everyting that the full version of SSMS has. And they don’t have Profiler or Database Engine Tuning Advisor. 2012 SP1 Express download does indeed have the Complete tool package.

Basic and Complete
The full SSMS (etc.) is referred to as “Management Tools – Complete”. This is only available with the Product you pay for and with 2012 SP1 Express. The only one available with the various free Express downloads (prior to 2012 SP1), is called “Management Tools – Basic”. You can explicitly request to install Basic from an install media that includes Complete, but you have to explicitly request that in the setup program. You don’t want to do that.

One difference between 2008R2 and 2012 is when you install from a pay-media and select that you want to install Express. For 2008R2, you then only have SSMS Basic available. For 2012, you have Complete. In other words, if you use a 2012 pay-media and select Express to install SSMS, you have the option to have the full-blown SSMS – Complete (including other tools, like Profiler).

The downloads
For SQL Server 2008R2, you have “Express Edition” and “Express Edition with Advanced Services”. The former is basically only the database engine, where the later has some Tools (SSMS Basic, primarily). See my earlier blog post for more details about 2008R2.

For 2012, there are bunch of downloads available. Note that if you want Complete tools, you need to download SP1 of the installers. You find SP1 here (and RTM, which you don’t want to use, here). SP1 includes Complete tools, and you will see that those downloads are significantly larger compared to RTM. It isn’t obvious what each exe files stand for, but scroll down and you will find pretty good explanations. I tried several of these (SSMS only, Express with Tools, Express with Advanced Services). They all have in common that for RTM the tool included is Basic, where for SP1 we have Complete.

So what is the difference between Basic and Complete?

In the table below, my focus was on what isn’t in Basic. In general, I don’t bother to list functionality which is available in both Basic and Complete. So, if the functionality isn’t in the table below, it is likely available in Basic. I might have missed something, of course! And my main focus was on SSMS and the database engine.


Component/Functionality 2008R2 2012 RTM 2012 SP1
Functionality in SSMS
Node for Agent Y Y Y
Graphical Execution Plans Y Y Y
Projects and Solutions N Y Y
Maint Plans, Wizard Y Y Y
Maint Plans, New, designer N (1) N (2) Y
Maint Plans, Modify N (1) N (2) Y
Node for SSIS Catalog N/A Y Y
Tools menu, Profiler N N Y
Tools menu, Tuning Advisor N N Y
Connect Object Explorer to:
Analysis Services N N Y
Reporting Services N N Y
Integration Services N N Y
Tools
Profiler N N Y
Database Engine Tuning Advisor N N Y

(1): The selections are there, but they were dead – nothing happened when you select them.
(2): The selections are there, but I got an error message when selecting any of them.

Spooky: What do you connect to?

I only recently discovered that SSMS will connect to different things. For instance, press the “New query” button. What were you connected to? The answer is the same server as your “current” server. But what is the current server? It is the server where you happened to have focus when the pressed the “New query” button. So, can you say whether you had focus in a query window, Object Exporer or Registered Servers?

This also applies to when you double-click a .sql file. And it doesn’t stop there. Open the “Registered Servers” window. Now, click on a server group. Go to explorer and double-click a .sql file. What were you connected to? Yes, all the servers in that group. Now, don’t get me wrong here; the ability to open the same query window against several servers can be a very useful thing. What I had no idea until just about now is how easily thsi can happen by mistake. Just by cklicking the New Query window, or even double-clicking an .sql file. So – be aware…

(FYI: SSMS 2005 doesn’t seem to do this for clicking a file in explorer, and the functionality to have a query window against several server didn’t exist in SSMS 2005…)