You have probably seen the recommendation to turn on the “optimize for ad-hoc workloads” setting. You might even have seen a more recent recommendation to set the database setting parameterization to forced (instead of the default which is simple). The aim of this post is to briefly describe each and then do some test with various settings.
I will not dive into each sub-area of this topic (plan caching, parameter sniffing, each setting, etc). There is loads of information out there, use your favourite search engine if there are areas mentioned here that you aren’t familiar with.
If you are unlucky you have application that submits queries as text to SQL Server and that text doesn’t use stored procedures, nor is it parameterized by the application. In short, the end result is that SQL server will recognize the query by producing a hash of the full text including your search arguments etc. The end result is typically lots and lots of execution plans for the same query. You have very little plan re-use (unless your users search for the very same things), and you litter the plan cache wasting precious memory.
Optimize for ad hoc workloads
Above setting exists at the instance level and since a few versions back also at the database level. SQL Server will not cache a plan for the first execution. It does save a hash of the text representation, though, so it can recognize if you execute the exact same text again and for second execution a plan will be saved. This can save memory. It will not save CPU.
Parameterization forced
This is a database setting that will make SQL Server parameterize most queries. This means that what you search for (etc) will be broken out as parameters and the same plan will be used even if you don’t search for the same values. This can save CPU and possibly also memory.
But you can end up with getting a plan which is good for some values but bad for some other values. This is what we refer to as a “parameter sniffing” problem. There are no free lunches. There has been some work done in this area in SQL Server 2022, but it is not as simple as “solving the problem”. See for instance this post by Brent Ozar.
How do these settings relate and putting some numbers on it
I want to actually tests things and see for myself instead of just reading some theoretical reasoning. This is risky since my very simple test isn’t representative for your query load. Keep that in mind. Having said that, here’s what I did:
I executed a query 30000 times. The query uses two search condition on the same table, and returns 0 rows. I’m interested in the plan aspect, not the query execution aspect.
Ideally I wanted to not return a resultset, but assigning the returned value to a variable caused the query to not be parameterized with forced parameterization. We don’t want to return 30,000 resultsets in SSMS, it takes ages, so the execution part was done using SQLCMD and some suitable command-line switches to minimize the output. Feel free to contact me if you have improvements to the test-bench I was using and I will possibly amend this blog post.
The plan generation is pretty cheap: full optimization with early termination (good enough plan found).
Here are my findings
Optimize for ad-hoc workloads
Parameterization forced
Time (seconds)
Memory used for plans (MB)
Off
Off
42
1640
On
Off
39
13
Off
On
3.2
470
On
On
3.3
3.4
Some things are less surprising:
Less surprising
The huge savings in memory with optimize for ad-hoc on
The reduced execution time with forced parametrization on.
More surprising
The large memory usage with optimize for ad-hoc off and forced parametrization on. Possibly some text representation of the query or some shell-plan causing this?
How well optimize for ad-hoc and forced parametrization play together
Anyhow, there you have it. Remember that this was a very simplified test. Feel free to grab the SQL below and tweak it. Let me know if you find something interesting.
/*
Create a proc that generates lots of execution plans
Each execution is in itself very cheap
Takes about 1.2 second per 1000 executions, i.e. 30000 executions takes about 40 seconds or less (for me)

We will be using this table:
SELECT * FROM Person.PersonPhone

And this query something like either of below two:
DBCC FREEPROCCACHE
SELECT TOP(1) BusinessEntityId FROM Person.PersonPhone WHERE PhoneNumberTypeID = 1 AND ModifiedDate = '20120523'
DECLARE @b int SET @b = (SELECT TOP(1) BusinessEntityId FROM Person.PersonPhone WHERE PhoneNumberTypeID = 1 AND ModifiedDate = '20120523')

The first we use if we want to test forced parameterization, which I couldn't get to work without actually returning a resultset.
Run this from SQLCMD, not SSMS since SSMS will have a huge overhead in printing header for all resultsets returned (or configure SSMS to discard the result).

The second query can be used from SSMS, but it won't parameterize even when the database setting is forced.

The plan is simple enough and very cheap.
*/


/**********************************************************************************************
Setup
**********************************************************************************************/

USE Adventureworks
GO

DROP INDEX IF EXISTS PhoneNumberTypeID ON Person.PersonPhone
DROP INDEX IF EXISTS ModifiedDate ON Person.PersonPhone
GO

CREATE INDEX PhoneNumberTypeID ON Person.PersonPhone(PhoneNumberTypeID)
CREATE INDEX ModifiedDate ON Person.PersonPhone(ModifiedDate)
GO

/**********************************************************************************************
A version thet doesn't return a resultset, can be used from SSMS.
it will NOT be parameterized with the database setting "Forced Parameterization"
**********************************************************************************************/
CREATE OR ALTER PROC CreateAdHocPlansNoResultset
 @noOfPlans int = 20000
AS
DECLARE
 @i int = 1
,@sql nvarchar(1000)
,@dt datetime2(1) = SYSDATETIME()
,@ModifiedDate char(8) = CONVERT(char(8), DATEADD(YEAR, -10, GETDATE()), 112)

SET NOCOUNT ON

WHILE @i <= @noOfPlans
BEGIN
 SET @sql = 'DECLARE @b int SET @b = (SELECT TOP(1) BusinessEntityId FROM Person.PersonPhone WHERE PhoneNumberTypeID = ' + CAST(@i AS varchar(5)) + ' AND ModifiedDate = ''' + @ModifiedDate + ''')'
-- PRINT @sql
 EXEC(@sql)
 SET @i +=1
END

SELECT DATEDIFF(ms, @dt, SYSDATETIME())
GO

/**********************************************************************************************
--A version that DOES return an (empty) resultset, and that will be parameterized.
**********************************************************************************************/
CREATE OR ALTER PROC CreateAdHocPlansWithResultset
 @noOfPlans int = 20000
AS
DECLARE
 @i int = 1
,@sql nvarchar(1000)
,@dt datetime2(1) = SYSDATETIME()
,@ModifiedDate char(8) = CONVERT(char(8), DATEADD(YEAR, -10, GETDATE()), 112)

SET NOCOUNT ON

WHILE @i <= @noOfPlans
BEGIN
 SET @sql = 'SELECT TOP(1) BusinessEntityId FROM Person.PersonPhone WHERE PhoneNumberTypeID = ' + CAST(@i AS varchar(5)) + ' AND ModifiedDate = ''' + @ModifiedDate + ''''
-- PRINT @sql
 EXEC(@sql)
 SET @i +=1
END

SELECT DATEDIFF(ms, @dt, SYSDATETIME())
GO


/**********************************************************************************************
Test

Run with below combinations:
	Optimize	Force
a	Off			Off
b	On			Off
c	Off			On
d	On			On

Time each execution, and check memory usage for plans
**********************************************************************************************/

--a
EXEC sp_configure 'optimize for', 0
RECONFIGURE
ALTER DATABASE Adventureworks SET PARAMETERIZATION SIMPLE
GO
--42 seconds, 1640 MB memory usage

--b
EXEC sp_configure 'optimize for', 1
RECONFIGURE
ALTER DATABASE Adventureworks SET PARAMETERIZATION SIMPLE
GO
--39 seconds,   13 MB memory usage

--c
EXEC sp_configure 'optimize for', 0
RECONFIGURE
ALTER DATABASE Adventureworks SET PARAMETERIZATION FORCED
GO
-- 3.2 seconds, 470 MB memory usage (the actual text respresentation of each query, I believe)

--d
EXEC sp_configure 'optimize for', 1
RECONFIGURE
ALTER DATABASE Adventureworks SET PARAMETERIZATION FORCED
GO
-- 3.3 seconds, 3.4 MB memory usage


/*
Run the tests and check the execution time, with above combination settings.
Use either SQLCMD (adjust servername) or straight TSQL from SSMS, but the query wont be parameterized.
SQLCMD /S <servername> -d Adventureworks /Q"DBCC FREEPROCCACHE EXEC CreateAdHocPlansWithResultset @NoOfPlans = 30000" -h-1
*/
DBCC FREEPROCCACHE EXEC CreateAdHocPlansNoResultset @NoOfPlans = 30000


--Investigate plan cache

/*
I have my own below proc:
EXEC sp_showplans
*/

--Break-down per how many time the plans has been executed
SELECT
 c.usecounts
,COUNT(*) AS antal
,SUM(c.size_in_bytes / (1024 * 1024.0)) AS size_in_MB
FROM sys.dm_exec_cached_plans AS c
GROUP BY c.usecounts
ORDER BY usecounts ASC

--Break-down per database
SELECT
 c.usecounts
,DB_NAME(CAST(a.value AS sysname))
,COUNT(*) AS antal
,SUM(c.size_in_bytes / (1024 * 1024.0)) AS size_in_MB
FROM sys.dm_exec_cached_plans AS c
 CROSS APPLY sys.dm_exec_plan_attributes(c.plan_handle) AS a
 WHERE a.attribute = 'dbid'
GROUP BY c.usecounts, DB_NAME(CAST(a.value AS sysname))
ORDER BY usecounts ASC
In SQL server 2022, we finally have an ORDER option when we create a columnstore index. But what does it really do?
Some basics first:
If you are familiar with rowgroups, segments and segment elimination, then you can skip this section.
Data for a columnstore index is divded in groups of approximate 1 million rows, rowgroups. Each rowgroup has a set of pages for each column. The set of pages for a column in a rowgroup is called a segment. SQL Server has meta-data for the lowest and highest value for a segment. There are no SEEKs in a columnstore index. But, SQL Server can use this meta-data to skip reading segments, with the knowledge that “this segment cannot contain any data that I need based on my predicates in my WHERE clause”.
Also, you might want to do these operations using MAXDOP 1, so we don’t have several threads muddling our neat segment alignment.
Making sure the data is sorted when building the index
Say that you want the rows with the earliest OrderDates in the first rowgroup, then the next 1 million rows (based on OrderDate) in the next rowgroup… and finally the most recent rows in the last rowgroup. We can do that without ORDER by “happening” to have a row-index on the same set of columns sorted in the way that we want the columnstore index to be sorted when building the index. I.e., SQL Server takes the path of least resistance and uses that row index when building the columnstore index. You achieve this by having a rowstore index with matching column key and re-create it as a columnstore index using DROP_EXISTING.
The new ORDER specification in SQL Server 2022 for the clustered columnstore index takes care of this for you. Nice.
Making sure the data is sorted when adding more data
The ORDER you specified for the clustered columnstore index is reflected in sys.index_columns, the column_store_order_ordinal column. This is used by the engine when you load data. Data will be sorted and loaded in that order.
This is fine if you add data aligned as how you have the ORDER specified. Say you have it on OrderDate and as you add new orders, you get new rowgroups for the new orders based on new data coming in will have increasing OrderDate.
This is a common situation, but what if the ORDER for the index doesn’t match with how the new data arrives? Then over time, you have added rowgroups containing data all over the place, including the segment(s) for the column(s) that you specified for the ORDER clause.
Making sure the data is sorted when rebuilding the index
This is what surprised me. I was expecting the column_store_order_ordinal column in sys.index_columns to be respected when I do ALTER INDEX REBUILD. But it isn’t. Nor is it respected if I do CREATE INDEX … WITH DROP_EXISTING.
So, bottom line is that we still have to use DROP_EXISTING to convert the table to a rowstore table, having a clustered index key that will match our ORDER. And then convert it again, to a columnstore table using that ORDER definition. Just like we are doing today.
Above is what my tests indicates. Let me know if I missed something obvious.
Here is the T-SQL I ran, requires the AdventureworksDW database.
USE AdventureworksDW
GO

--Supporting proc
CREATE OR ALTER PROC GetSegmentAlignment
@tablename sysname
AS
SELECT
 COL_NAME(ic.object_id, ic.column_id) as ColumnName
,s.segment_id
,s.min_data_id
,s.max_data_id
,s.row_count
,s.on_disk_size
FROM sys.column_store_segments AS s
INNER JOIN sys.partitions AS p ON p.hobt_id = s.hobt_id
INNER JOIN sys.indexes AS i ON   i.object_id = p.object_id AND  i.index_id = p.index_id
LEFT  JOIN sys.index_columns AS ic ON ic.object_id = i.object_id AND  ic.index_id = i.index_id AND  ic.index_column_id = s.column_id
WHERE OBJECT_NAME(p.object_id) = @tablename
AND ic.column_id IS NOT NULL
ORDER BY s.column_id, p.partition_number, s.segment_id
GO


DROP TABLE IF EXISTS NewFact
GO

--Create heap using SELECT INTO
SELECT * INTO NewFact
FROM FactResellerSalesXL_CCI
WHERE UnitPrice < 400

--Create the ORDERed clustered columnstore index
CREATE CLUSTERED COLUMNSTORE INDEX NewFact ON NewFact ORDER(OrderDateKey) WITH(MAXDOP = 1)

--Verify index is ORDERed
SELECT i.name, i.type_desc, c.column_id, COL_NAME(c.object_id, c.column_id) as ColumnName, c.column_store_order_ordinal
FROM sys.indexes AS i
INNER JOIN sys.index_columns AS c ON i.index_id = c.index_id AND i.object_id = c.object_id
WHERE i.object_id = OBJECT_ID('NewFact')

--Check segment alignment, nicely aligned on OrderDateKey
EXEC GetSegmentAlignment 'NewFact'

--Load the rest of the data
INSERT INTO NewFact
SELECT *
FROM FactResellerSalesXL
WHERE UnitPrice >= 400

EXEC GetSegmentAlignment 'NewFact'
--The whole table is not re-aligned, but *new* data is aligned based on indexe's ORDER

--Try any of below

ALTER INDEX NewFact ON NewFact REBUILD WITH (MAXDOP = 1)
EXEC GetSegmentAlignment 'NewFact'
--Segments are not aligned

CREATE CLUSTERED COLUMNSTORE INDEX NewFact ON NewFact ORDER(OrderDateKey) WITH(DROP_EXISTING = ON, MAXDOP = 1)
EXEC GetSegmentAlignment 'NewFact'
--Segments are not aligned
You might have read about the term Query Buck or Query Bucks. The term was coined by Kendra Little according this Brent Ozar post.
Basically, in order for a query (or an operator to be more specific) to go parallel, SQL server will have to estimate more than a certain amount of execution “time” for a query. This “time” was allegedly trimmed in on a machine from 1997 (see for instance this post).
There are plenty of articles out there recommending you to up the “cost threshold for parallelism” configuration option. Most of you already know this, if not fire up your favorite search engine and spend a few minutes reading about it.
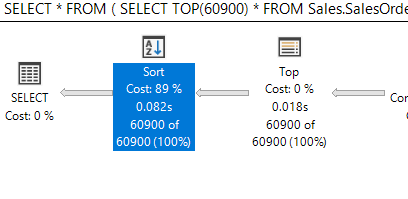
My aim here is to do a totally non-scientific test if I can translate these fictitious seconds to what they correspond to on a reasonably modern hardware – which is my laptop from 2020. Here’s the query I use and I tuned the number for TOP to get pretty close to 5 (seconds), by looking at he “Esimated Subtree Cost” for the SELECT operator in the actual execution plan:
SELECT *
FROM
(
SELECT TOP(60900) * FROM Sales.SalesOrderDetail
) AS i
ORDER BY OrderQty
OPTION(MAXDOP 1)
I then looked at the operators in the actual execution plan for the aggregated seconds for the next-top operator:
So, for this query, 5 seconds on a machine from 1997 corresponds to 0.082 seconds on my laptop from 2020. I.e., my machine is about 60 times faster (50 / 0.082) than that machine from 1997. So, on Nick’s computer from 1997, “cost threshold for parallelism” of 5 mean that the query should go parallel if the estimated cost is higher than 5 seconds. If I want the “go parallel of the query is slower than 5 seconds” on my machine, I should configure “cost threshold for parallelism” to 300.
This is of course totally non-scientific. I only look at one query, for instance. And I assume that the aggregated seconds in the execution plan actually is a relevant way to measure this.
For reference, the CPU I’m using is reported by msinfo as below. Needless to say, I’m on an SSD disk.
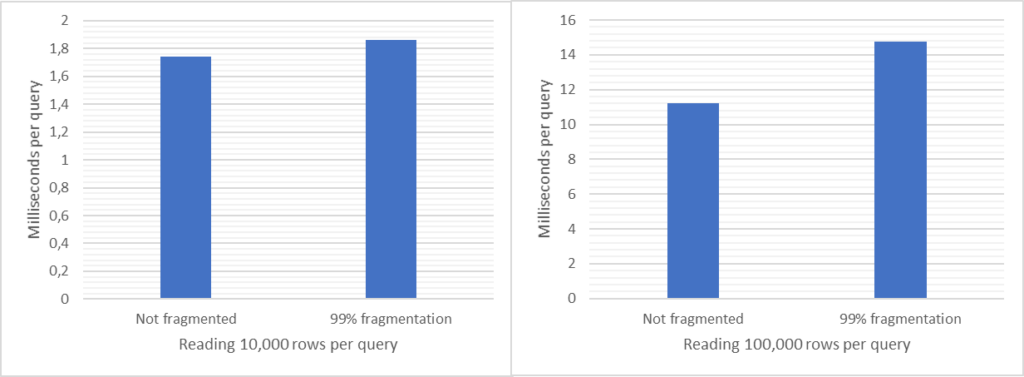
How much do you gain from defragmenting your indexes?
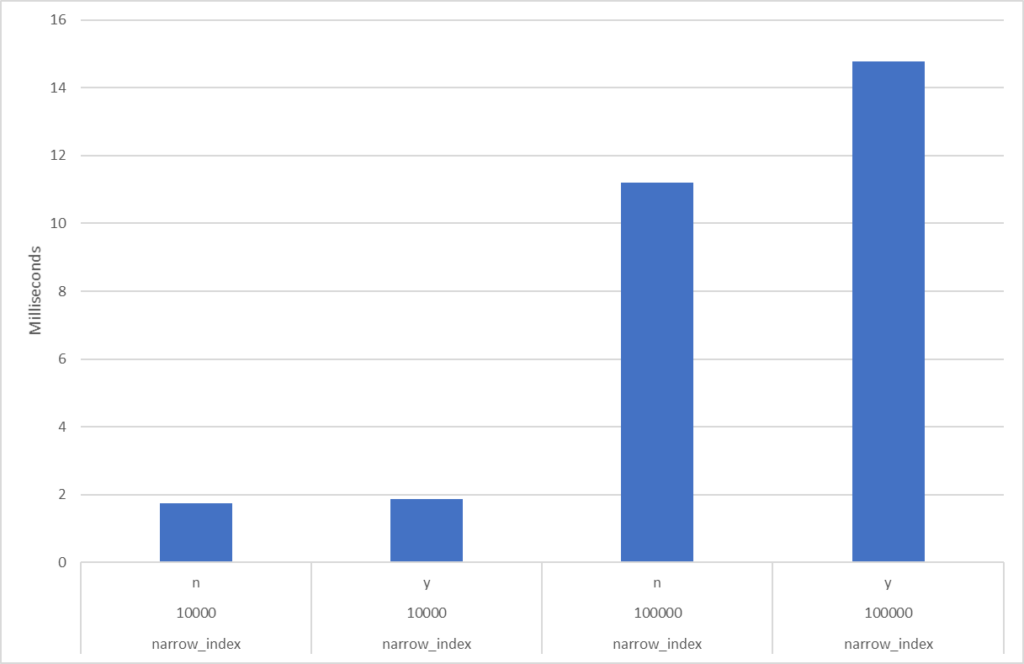
Let me show you. Below are diagrams for tables (indexes) with 0% fragmentation vs. over 99% fragmentation. To the left is response time for the an unfragmented index and to the right is fragmented index. The query is super-simple doing pretty much only I/O (physical, not cached) and doesn’t return any data to the client. I.e., we pretty much compare only the I/O portion:
Narrow indexWide index
Not that much, huh? Read on for details:
Background
It has been a few years since I wrote about index fragmentation. For my earlier posts, I both elaborate in writing about the topic and I also ran some tests to try to quantify the difference. I want to revisit the topic for a few reasons:
I want to have one (1) post to point to when this topic comes up.
I want to clean up the text.
I’m running these tests on my laptop, and I have a new laptop since I last ran the tests. (I’d love to run these on a real server, but there are many reasons why that isn’t doable/practical for me.)
The last time i wrote three blog posts. The main reason for that was that my tests for the first and second blog posts were flawed (because of buffer pool ramp-up and auto-stats).
In the end I want to discuss internal and external fragmentation and also show some numbers. The numbers are of course what I measured on my machine with my load. You find the T-SQL code at the end if you want to play with this yourself. Some of the text below are from my earlier blog posts.
TLDR
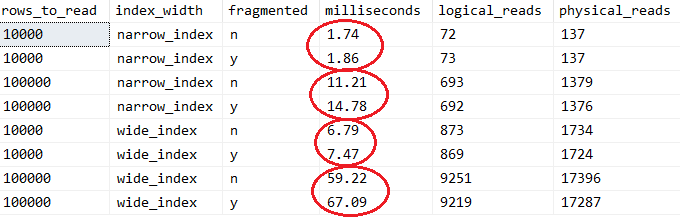
See numbers and diagrams at the end, or at the top. I measured a few cases: the difference between no external fragmentation and severe external fragmentation (over 99%). I have both a narrow index and a wide index, and I read one (1), 10,000 and 100,000 rows using index searches (“range scan”). There were obviously no difference reading 1 row so I exclude that from my discussion below. For the other cases the extra time with an extreme level of external fragmentation is (from lowest impact to highest) 7%, 10%, 13% and 32%. The highest number (32%) is when reading many rows from a narrow index, i.e. many rows per page. Again, this is with an extreme level of fragmentation.
What is index fragmentation?
By index here I mean b-tree indexes. You know, the regular types of indexes. I’m not referring to “odd” indexes such as columnstore, hash, geospatial, fulltext, or xml indexes. For a b-tree index (from now on, I will just say “index”), the leaf level is stored according the order of the index key. I.e., the leaf is sorted. As you modify data, you can get page splits. Imagine inserting a row “in the middle” and there’s no room on the page. SQL server will split the page, by inserting a page from somewhere into the linked list, move 50% to that new page, and then add the row to where it should be.
If you now follow the linked list, you jump back and forth in the data file: external fragmentation.
The page split left us with two (nearly) half-full pages: internal fragmentation.
What do we do about it?
Duh, we defragment the indexes, of course! The two commonly used methods are:
Rebuild the indexes. ALTER INDEX … REBUILD. This will create a new index and then remove the old index. This requires free space in the database file(s) about the same size as the index.
Reorganize the index. ALTER INDEX … REORGANIZE. Basically walk the linked list and for every time you have to go backward in the file when going to the next page, you swap these two pages. It does a bit more than that (re-introduce the fillfactor), but essentially swapping places of the pages not going forwards physically in the file.
While doing defrag, we might leave some free space on each page (aka fillfactor). Rebuild allow us to specify the fillfactor, while reorg will re-apply whatever value you specified when creating the index.
Why might fragmentation hurt us?
Several aspects here. Let us discuss them one by one:
Lots of empty space
Yes, a page split leaves us with two half-full pages. At that point in time. But as more rows are added, they will fit on that free space.
In the end, you will probably average at about 75% fullness (75% being in between half-full and full). That is for indexes where the inserts (and possibly updates) are inserted “all over the place”.
But we also have increasing indexes. Think columns such as “OrderDate”. Or identity/sequence columns, which are pretty often primary keys, which in turn pretty often are also the clustered index. For such an index, inserts will always add rows to the end of the linked list, and SQL Server will just add pages to the end – not “splitting” any page. (Yeah, adding a page to the end of the linked list is technically called a page split in SQL Server lingo, but that show more the problems that SQL server has with terminology than anything else.) The point here is that increasing indexes will not have free space in them because of inserts going to the end.
Common values I’ve seen for fillfactor in rebuild scripts are between 70 and 80%.
For increasing indexes, that just make the indexes bigger. And remember that it isn’t unlikely that the actual data is an increasing index (the clustered index). So, instead of having a 100 GB table, you now have a 120 GB table.
For other indexes, you probably get about the same size “naturally” (without doing defrag) as when doing a defrag (depending on your fillfactor, of course).
Pages are out of order
Ask your SAN people how much difference there is between sequential I/O and random I/O in your SAN. The answer to this question will tell you whether this point is relevant. For a single spinning disk, there is a big difference. With sequential I/O you don’t have the disk head movement. But as you introduce more disks in various RAID configs, add in a SAN in the mix and now have a bunch of disks and also other concurrent activity apart from your SQL Server in that SAN, the picture isn’t so clear anymore. Now add SSD or some similar technology to the mix. In the end, there might not be much of a difference between random and sequential I/O on a modern storage solution.
Splitting a page takes time
Yup, sure does. If you can defragment frequently enough with a chosen fillfactor for each index so that they never split, then you avoid this. But how many of us do that? I.e., hand craft the chosen fillfactor for each index by observing the amount of fragmentation for each index since last time we did defrag, and repeat this week after week until we tuned the “perfect” fillfactor for each index? Some of us might actually do that, but as a consultant, I can tell you that none of my clients have opted for me to do that type of work. In the end, I’m not that certain that we reduce page splits by doing our regular defrag, at least not to the extent that we hope for.
Splitting writes to the transaction log.
Yes, it does. But again, how much difference is there in reality between defrag and not defrag regarding page splits occurring during business hours.
Why might doing defrag hurt us?
Of course there is another side of the coin! Defrag isn’t free. When people asking me whether to defrag, a short question back from me is “How much does it hurt?” If the answer is “None at all”, then sure go ahead! If the answer is “A lot!”, then we want to think twice.
It reduces concurrency because of locking
Rebuild has an ONLINE option available if you are on Enterprise Edition (EE), which makes the rebuild essentially online. But using online causes the rebuilt to take longer time compared to offline.
If not on EE, then the whole table will be locked.
Shared lock if the rebuild is on a nonclustered index – this allow concurrent reads but not modifications.
Exclusive locks if the index is a clustered index – disallowing both read and modifications.
Reorg will only put a brief lock of the two pages “where it currently is”. This makes reorg much more online-ish than rebuild on non-EE.
It puts load your system
Say you have a 200 GB database, and rebuild everything. Now you shuffle 200 GB data. This isn’t free. Even if you use smarter scripts to only defrag what is actually fragmented in the first place, defrag will probably shuffle quite a lot of data. Your VM/SAN/SQL/whatever probably have other things to do at night-time. We all fight over these precious night/weekend hours. And for systems that are expected to be online pretty much all the time, this is even more pressing. Now throw this into the cloud and you can convert that type of work into real money!
You will need a larger LDF file
If you rebuild everything (blindly) then the ldf file need to be the same size as the (sum of) data file(s). A smart script perhaps only rebuild 30% of the data, cutting this down to some 30% of the data size. (This doesn’t apply to simple recovery model.)
The following log backup will be large
Again, if you rebuild 100 GB worth of indexes, then the subsequent log backup will be 100 GB in size. Etc. You get the picture by now. (Again this doesn’t apply to simple recovery model.)
What about page fullness?
To be honest, I find this to be a much more interesting aspect. I’d like to split this into two sub-sections. Increasing and “random” index.
Increasing index
This can be like an identity or ever increasing datetime column (think for instance order_date). This will not become fragmented from INSERTS and assuming that you don’t delete “every other row”, then you will end up with a nice unfragmented index with a high degree of page fullness. If you rebuild it with a fillfactor of 100%, you have just wasted resources. If you rebuild it with a lower fillfactor, you also waste space and cause SQL Server to read more data when the index is used – causing worse performance.
Random index
By this I mean index where the data distribution is all over the place. For instance an index on the LastName column. As you insert data, pages are split and you end up with a fillfactor of about 75% (which is in between a half-full and a full page). If you rebuild it with a similar fillfactor, you didn’t gain anything. If you rebuild it with a high fillfactor, then the following activity in your database will generate a high number of page splits. It seems reasonable to let it be, accepting a fillfactor of about 75% and accept a page split happening every now and then.
But we also delete data!
Do you? Really? OK, let us say that you do. What is the delete pattern? And the degree of deletes? How does this spread over your particular index? Deleting old data over some ever increasing index will just deallocate those pages. Deleting data which doesn’t match with the index key (rows deleted are spread all over the index) will leave empty space. This will be re-used as you insert new rows. But if you delete a lot of data all over the place, then you will have a low degree of page fullness. IMO, this is a rather unusual situation and should warrant a manually triggered index maintenance, in contrast to rebuilding indexes every week or so. (And don’t get me started on heaps, but surely you don’t have those…? I once had a SELECT of all rows for a table with only 3000 rows, which took minutes. It had allocated more extents than number of rows in the table. Rebuild the heap, and that SELECT took, of course, sub-second. Until this degraded again, over time. Needless to say, this didn’t stay as a heap for long. And no, the table wasn’t wide, at all.)
But my friend had a query that went from 10 minutes to 1 second after defrag!
Yeah, that was because the statistics were also updated by the index rebuild resulting in a different execution plan. As soon as you see big differences, it is because of statistics update, not the defrag per se.
I like to provide the optimizer with as high-quality statistics as possible. Sure, index rebuild will give you new statistics. But if you condition it based on fragmentation, then you end up with not rebuilding a bunch of indexes and have stale statistics. Auto update statistics is OK, but you have to modify a decent amount of data before it kicks in. And when it kicks in, the user waits for it. Unless you do async update…. But I digress. Statistics management is a topic of its own. My point is that you probably don’t want to lose track of statistics management because you keep staring as index fragmentation.
Things to consider and watch out for
Here are some of the things that can throw you off when you play with these things.
Auto-update of statistics
I was bitten by this on my first test. I did a SELECT after modifying many rows (which fragmented the index) and this triggered auto-update statistics, meaning that SELECT took a very long time.
Buffer pool ramp-up
If you have Enterprise Edition, then there’s a “smartness” that reads more data than necessary if you have lots of free memory. Paul White told me about a lesser known optimization where SQL server will do “large I/O” (my own term for this) if you have plenty of unused memory. Instead of reading single pages, it reads whole extents. This makes sense, warming up the cache. https://blogs.msdn.microsoft.com/ialonso/2011/12/09/the-read-ahead-that-doesnt-count-as-read-ahead/
Read-ahead
Just for fun, I ran my tests while disabling read-ahead (aka sequential-prefetch) and it took from 3 to 8 times longer with RA disabled. So, yes, RA can make a huge difference.
Show me the numbers already!
OK, sure! Some basics first: I was using two tables, both with a clustered index. I’m focusing on external fragmentation, i.e., jumping back and forth on disk when following the linked list. For both cases I was using a clustered index. The query seeked the index, and then followed the linked list to read as many pages/rows from the leaf that satisfied the search condition. I was both using a narrow index (about 200 rows per page) and a wide index (about 11 rows per page). I ran the queries a with 10,000 and also 100,000 rows selectivity. I didn’t re-read the same rows, so for each SELECT, the rows were read from disk.
Compare the numbers in the red circles. This is the average elapse time per SELECT. The top within each circle is without fragmentation and bottom is with over 99% fragmentation.
Some facts:
I executes a SELECT statement several times, not reading the same data over and over again.
For the millisecond column I measured the time it took to execute all queries and divide with number of queries. I.e., it is an average per query.
For the logical_reads and physical_reads columns I used and Extended Events trace to capture number of I/O per SELECT statement and then average those numbers.
I did a rebuild with a fillfactor to achieve the same page fullness. See above section about page fullness for a discussion of that topic. For this test I was interested in external fragmentation.
Note a higher number of physical reads than logical reads. That is read-ahead in action. When disabling RA, I had the same numbers for both physical and logical reads (and between 3 to 8 times longer elapse time).
Here are some diagrams over the numbers. The narrow index, with no fragmentation (n) and high fragmentation (y), and reading 10,000 and 100,000 rows:
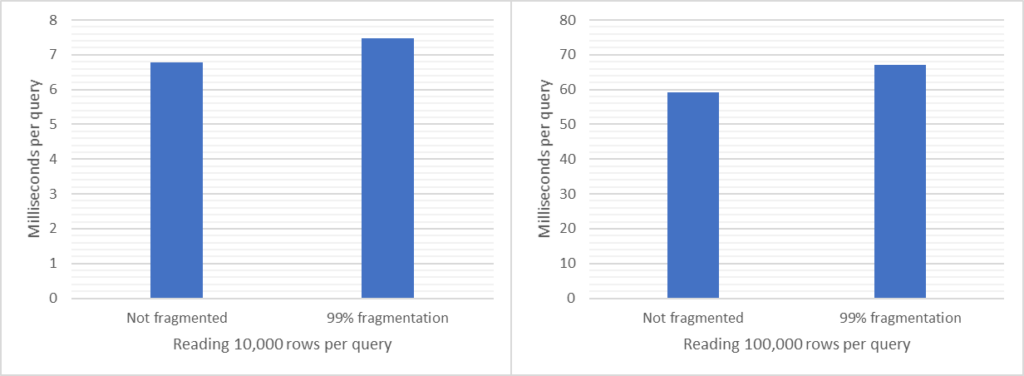
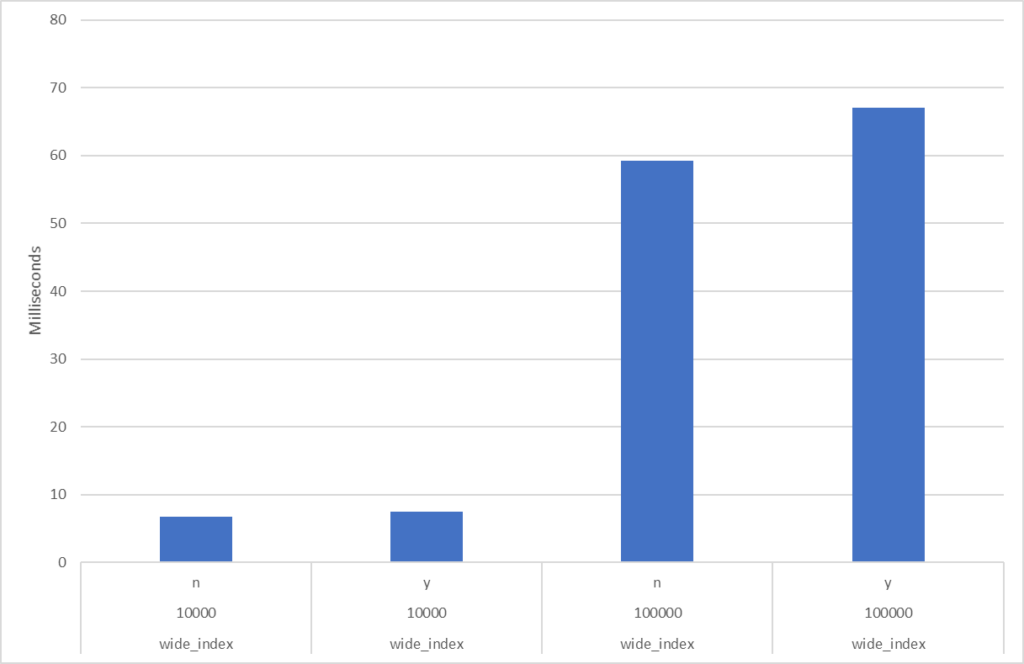
And the wide index, again with no fragmentation (n) and high fragmentation (y), and reading 10,000 and 100,000 rows:
What about the old blog posts?
I have added pretty much everything into this blog post, but in case you want to check them out:
This section is about the code I used. Feel free to use it for your own tests. Below is the basic flow of the code, from my last blog post. I did some modifications and tidy-up of the code for this new blog post, but I’m too lazy to go over the bulleted list below to reflect those changes.
Create a proc which does bunch of reads to fill the buffer pool with data.
Create some other supporting stuff, like trace definition, trace control procedure etc.
Grow the data and log files for the Stackoverflow (10 GB) database.
Create table to hold my measures.
Create the narrow_index table which is a table with a clustered index which is narrow. A row is some 40 bytes (very rough calculation off the top of my head).
Create the wide_index is a table with a clustered index which is wider – some 340 bytes.
Set max server memory to 1 GB.
Turn off auto-update statistics.
Create the proc that will do the tests.
Generate fragmentation in both indexes/tables.
The narrow table has 20,000,000 rows and is about 970 MB in size.
The wide table has 10,000,000 rows and is about 6.8 GB in size.
Run the proc that does the test with 1 row selectivity.
Run the proc that does the test with 10000 rows selectivity.
Run the proc that does the test with 100000 rows selectivity.
Each test runs 99 SELECTs, spread over the data (so not to read the same row).
Average the result, into a table named resx.
I did 4 such iterations, so I have the tables res1, res2, res3 and res4.
Check the numbers from these tables and see if they correspond reasonably. They did.
Average the results from these four table to get the end results.
The procedure which executes the SELECTS and captures the measures has this basic flow
Stop the (XE) trace if it is running.
Delete all old trace files.
Do a first SELECT to get rid of auto-stats (yeah, I disabled it, but just in case).
Empty the cache.
Reads lots of other data into cache.
Start the trace
Do the SELECT, in a loop, reading as many rows as requested (param to the proc), as many times as requested (another param to the proc). Don’t read the same data over and over again. This is done both for the narrow and wide table/index.
Capture memory usage for each table (buffer pool usage).
Get the trace raw data into a temp table.
Parse the trace data/above table using XQuery into the measures table.
Ie., we now have one row for each SELECT with a bunch of measures.
T-SQL
 --Measure cost of fragmentation in terms of execution time and memory usage
 --Tibor Karaszi, 2019. Revisited and modified 2022.
 --Requires the Stackoverflow database. I was using the 10 GB version.
 SET NOCOUNT ON

 --Setup section
 USE StackOverflow
 GO
 --Proc to study plans
 CREATE OR ALTER VIEW vShowPlans
 AS
 SELECT
  DB_NAME(sql.dbid) AS db_name_
 ,OBJECT_NAME(sql.objectid) AS object_name_
 ,p.cacheobjtype
 ,p.objtype
 ,s.execution_count
 ,s.total_worker_time --Add whatever measures you want
 ,p.size_in_bytes / 1024 AS size_in_kB
 ,SUBSTRING (sql.[text],(s.statement_start_offset/2) + 1,((CASE s.statement_end_offset WHEN -1 THEN DATALENGTH(sql.[text]) WHEN 0 THEN DATALENGTH(sql.[text]) ELSE s.statement_end_offset END - s.statement_start_offset)/2) + 1) AS text_query
 ,sql.text AS text_batch
 ,qp.query_plan
 --,*
 FROM sys.dm_exec_query_stats  AS s
 INNER JOIN sys.dm_exec_cached_plans AS p ON s.plan_handle = p.plan_handle
 CROSS APPLY sys.dm_exec_sql_text(s.plan_handle) AS sql
 CROSS APPLY sys.dm_exec_query_plan(s.plan_handle) AS qp
 WHERE sql.dbid <> 32767 --Igorera resursdatabasen
 GO
 --Proc to fill buffer pool, reads lots of data, takes a while to execute
 CREATE OR ALTER PROC fill_bp
 AS
 DECLARE @a bigint
 SET @a = (SELECT AVG(CAST(PostId AS bigint)) FROM Comments)
 SET @a = (SELECT AVG(CAST(CommentCount AS bigint)) FROM Posts)
 SET @a = (SELECT AVG(CAST(PostId AS bigint)) FROM Comments)
 SET @a = (SELECT AVG(CAST(VoteTypeId AS bigint)) FROM Votes)
 SET @a = (SELECT AVG(CAST(PostId AS bigint)) FROM Comments)
 SET @a = (SELECT AVG(CAST(VoteTypeId AS bigint)) FROM Votes)
 SET @a = (SELECT AVG(CAST(VoteTypeId AS bigint)) FROM Votes)
 GO
 --Disable IAM order scan, so we know that SQL Server will follow the linked list
 --See https://sqlperformance.com/2015/01/t-sql-queries/allocation-order-scans
 EXEC sp_configure 'cursor threshold', 1000000 RECONFIGURE
 GO
 --Run the initial "prepp" section without restrictions, so it doesn't take too long
 EXEC sp_configure 'max server memory', 26357 RECONFIGURE
 ALTER DATABASE SCOPED CONFIGURATION SET MAXDOP = 0
 GO
 --Proc to change trace status
 CREATE OR ALTER PROC change_trace_status
      @state varchar(50) --start, stop, delete_all_files
     AS
 IF @state = 'start'  BEGIN    IF NOT EXISTS (SELECT * FROM sys.dm_xe_sessions WHERE name = 'frag_test')     ALTER EVENT SESSION frag_test ON SERVER STATE = START  END IF @state = 'stop' BEGIN    IF EXISTS (SELECT * FROM sys.dm_xe_sessions WHERE name = 'frag_test')      ALTER EVENT SESSION frag_test ON SERVER STATE = STOP  END --Delete XE file, using xp_cmdshell (ugly, I know) IF @state = 'delete_all_files' BEGIN   EXEC sp_configure 'xp_cmdshell', 1 RECONFIGURE WITH OVERRIDE   EXEC xp_cmdshell 'DEL C:\R\frag_test*.xel', no_output    EXEC sp_configure 'xp_cmdshell', 0 RECONFIGURE WITH OVERRIDE END /* EXEC change_trace_status @state = 'start' EXEC change_trace_status @state = 'stop' EXEC change_trace_status @state = 'delete_all_files' */
 GO
 --Drop and create event session to keep track of execution time
 EXEC change_trace_status @state = 'stop'
 WAITFOR DELAY '00:00:01'
 IF EXISTS (SELECT * FROM sys.server_event_sessions WHERE name = 'frag_test')
  DROP EVENT SESSION frag_test ON SERVER
 EXEC change_trace_status @state = 'delete_all_files'
 CREATE EVENT SESSION frag_test ON SERVER
     ADD EVENT sqlserver.sp_statement_completed()
     ADD TARGET package0.event_file(SET filename=N'C:\R\frag_test')
     WITH (MAX_DISPATCH_LATENCY=10 SECONDS)
 GO
 --Create proc to report progress
 CREATE OR ALTER PROC #status
  @msg varchar(200)
 AS
 RAISERROR(@msg, 10, 1) WITH NOWAIT
 GO
 --Grow the data and log files for StackOverflow database.
 EXEC #status 'Grow the data and log files for StackOverflow database…'
 IF EXISTS(    SELECT size * 8/(1024*1024), *
             FROM sys.database_files
             WHERE name = N'StackOverflow2010' AND size * 8/(1024*1024) < 30)
     ALTER DATABASE [StackOverflow] MODIFY FILE ( NAME = N'StackOverflow2010', SIZE = 30GB )
 IF EXISTS(    SELECT size * 8/(1024*1024), *
             FROM sys.database_files
             WHERE name = N'StackOverflow2010_log' AND size * 8/(1024*1024) < 15)
     ALTER DATABASE [StackOverflow] MODIFY FILE ( NAME = N'StackOverflow2010_log', SIZE = 15GB )
 GO
 --Table to hold output
 DROP TABLE IF EXISTS measures
 CREATE TABLE measures (
  id int identity(1,1) PRIMARY KEY NOT NULL
 ,rows_to_read int NOT NULL
 ,index_width varchar(20) NOT NULL
 ,fragmented varchar(2) NOT NULL
 ,usec_xe bigint NOT NULL
 ,usec_clock bigint NOT NULL
 ,cpu_microsec bigint NOT NULL
 ,physical_reads bigint NOT NULL
 ,logical_reads bigint NOT NULL
 ,mb_cache decimal(9,2) NOT NULL
 );
 --Create the table for the narrow index
 EXEC #status 'Setup section. Create table with narrow index…'
 DROP TABLE IF EXISTS narrow_index
 --Adjust numbers. 20,000,000 rows means about 970 MB in the end
  --540 MB with dense data (we do not measure on this)
  --970 MB after fragmentation/rebuild with a fillfactor to get same number of pages as wehn data is fragmented
 SELECT TOP(1000100020) ROW_NUMBER() OVER( ORDER BY (SELECT NULL)) AS c1, CAST('Hello' AS varchar(82)) AS c2
 INTO narrow_index
 FROM sys.columns AS a, sys.columns AS b, sys.columns AS c
 CREATE CLUSTERED INDEX x ON narrow_index(c1)
 --Create the table for the wide index
 EXEC #status 'Setup section. Create table with wide index…'
 DROP TABLE IF EXISTS wide_index
 --Adjust numbers. 10,000,000 rows give us about
  --3.4 GB with dense data (we do not measure on this)
  --6.8 GB after fragmentation/rebuild with a fillfactor to get same number of pages as wehn data is fragmented
 SELECT
  TOP(1000100010) ROW_NUMBER() OVER( ORDER BY (SELECT NULL)) AS c1
 ,CAST('Hi' AS char(80)) AS c2
 ,CAST('there' AS char(80)) AS c3
 ,CAST('I''m' AS char(80)) AS c4
 ,CAST('on' AS char(80)) AS c5
 ,CAST('my' AS varchar(200)) AS c6
 INTO wide_index
 FROM sys.columns AS a, sys.columns AS b, sys.columns AS c
 CREATE CLUSTERED INDEX x ON wide_index(c1)
 GO

 --Investigate the data if you want
 /*
 --wide index
 SELECT TOP(100) * FROM wide_index
 EXEC sp_indexinfo wide_index        --Found on my web-site
 EXEC sp_help 'wide_index'
 --narrow index
 SELECT TOP(100) * FROM narrow_index
 EXEC sp_indexinfo narrow_index        --Found on my web-site
 EXEC sp_help 'narrow_index'
 */

 --/Setup section

 --Create the proc that executes our SQL
 EXEC #status 'Create the proc that executes our SQL…'
 GO
 CREATE OR ALTER PROC run_the_sql
  @fragmented varchar(20)
 ,@rows_to_read int
 ,@range_iterations int
 ,@fill_bp char(1)            --'y' or 'n'
 ,@report_frag char(1) = 'n'
 AS
 DECLARE
  @sql nvarchar(1000)
 ,@sql_condition varchar(1000)
 ,@bp_wide_mb decimal(9,2)
 ,@bp_narrow_mb decimal(9,2)
 ,@range_start int
 ,@range_end int
 ,@range_iterations_counter int
 ,@a int
 ,@start_time datetime2
 ,@exec_time_wide_index_usec bigint
 ,@exec_time_narrow_index_usec bigint
 ,@parm_definition nvarchar(200)
 SET STATISTICS IO OFF
 EXEC change_trace_status @state = 'stop'
 EXEC change_trace_status @state = 'delete_all_files'
 --Do a first execution to get autostats etc out of the way
 DBCC FREEPROCCACHE
 SET @range_iterations_counter = 1
 SET @range_start = 1000
 SET @range_end = @range_start + @rows_to_read - 1
 SET @parm_definition = '@range_start int, @range_end int'
 SET @sql = N'DECLARE @a int SELECT @a = COUNT_BIG(c1) FROM wide_index WHERE c1 BETWEEN @range_start AND @range_end'
 EXEC sp_executesql @sql, @parm_definition, @range_start,  @range_end
 SET @sql = N'DECLARE @a int SELECT @a = COUNT_BIG(c1) FROM narrow_index WHERE c1 BETWEEN @range_start AND @range_end'
 EXEC sp_executesql @sql, @parm_definition, @range_start,  @range_end
 --Empty data cache (buffer pool, BP)
 CHECKPOINT
 DBCC DROPCLEANBUFFERS
 --Run proc to read stuff into BP if requested
 IF @fill_bp = 'y'
   EXEC fill_bp
 --Start the trace
 EXEC change_trace_status @state = 'start'
 --Do the SELECTs, narrow index
 SET @sql = N'DECLARE @a int SELECT @a = COUNT_BIG(c1) FROM narrow_index WHERE c1 BETWEEN @range_start AND @range_end'
 SET @range_iterations_counter = 1
 SET @range_start = 1000
 SET @range_end = @range_start + @rows_to_read - 1
 SET @start_time = SYSDATETIME()
 WHILE @range_iterations_counter <= @range_iterations
 BEGIN
     EXEC sp_executesql @sql, @parm_definition, @range_start,  @range_end
     SET @range_start = @range_start + @rows_to_read
     SET @range_end = @range_end + @rows_to_read
     SET @range_iterations_counter += 1
 END
 SET @exec_time_narrow_index_usec = DATEDIFF_BIG(microsecond, @start_time, SYSDATETIME()) / @range_iterations
 --Do the SELECTs, wide index
 SET @sql = N'DECLARE @a int SELECT @a = COUNT_BIG(c1) FROM wide_index WHERE c1 BETWEEN @range_start AND @range_end'
 SET @range_iterations_counter = 1
 SET @range_start = 1000
 SET @range_end = @range_start + @rows_to_read - 1
 SET @start_time = SYSDATETIME()
 WHILE @range_iterations_counter <= @range_iterations
 BEGIN
     EXEC sp_executesql @sql, @parm_definition, @range_start,  @range_end
     SET @range_start = @range_start + @rows_to_read
     SET @range_end = @range_end + @rows_to_read
     SET @range_iterations_counter += 1
 END
 SET @exec_time_wide_index_usec = DATEDIFF_BIG(microsecond, @start_time, SYSDATETIME()) / @range_iterations
 EXEC change_trace_status @state = 'stop'
 --Show the execution plan statistics
 --SELECT @fragmented AS frag_level, * FROM vShowPlans as p WHERE p.db_name_ = DB_NAME() AND text_query LIKE '%wide_index%' OR text_query LIKE '%narrow_index%' ORDER BY text_query
 --Keep track of BP usage
 SET @bp_wide_mb =
 (
             SELECT
             CAST((COUNT(*) * 8.00) / 1024 AS DECIMAL(9,2)) AS MB
             FROM  sys.allocation_units AS a
               JOIN sys.dm_os_buffer_descriptors AS b
                 ON a.allocation_unit_id = b.allocation_unit_id
               JOIN sys.partitions AS p
                 ON a.container_id = p.hobt_id
             WHERE p.object_id = OBJECT_ID('wide_index')
               AND b.database_id = DB_ID()
 )
 SET @bp_narrow_mb =
 (
             SELECT
             CAST((COUNT(*) * 8.00) / 1024 AS DECIMAL(9,2)) AS MB
             FROM  sys.allocation_units AS a
               JOIN sys.dm_os_buffer_descriptors AS b
                 ON a.allocation_unit_id = b.allocation_unit_id
               JOIN sys.partitions AS p
                 ON a.container_id = p.hobt_id
             WHERE p.object_id = OBJECT_ID('narrow_index')
               AND b.database_id = DB_ID()
 )
 --Wait for trace data to arrive in target
 WAITFOR DELAY '00:00:10'
 --Get the trace data into our table
 SELECT CAST(event_data AS XML) AS StatementData
 INTO #myRawXeData
 FROM sys.fn_xe_file_target_read_file('C:\R\frag_test*.xel', NULL, NULL, NULL);
 --Done with trace file, delete it
 EXEC change_trace_status @state = 'delete_all_files';
 --Transform raw trace data into our measures table
 WITH t AS(
 SELECT
  StatementData.value('(event/data[@name="duration"]/value)[1]','bigint') AS duration_microsec
 ,StatementData.value('(event/data[@name="cpu_time"]/value)[1]','bigint') AS cpu_microsec
 ,StatementData.value('(event/data[@name="physical_reads"]/value)[1]','bigint') AS physical_reads
 ,StatementData.value('(event/data[@name="logical_reads"]/value)[1]','bigint') AS logical_reads
 ,StatementData.value('(event/data[@name="statement"]/value)[1]','nvarchar(500)') AS statement_
 --,StatementData.value('(event[1]/@timestamp)','datetime') AS timestamp_
 FROM #myRawXeData AS evts
 WHERE StatementData.value('(event/data[@name="statement"]/value)[1]','nvarchar(500)') LIKE '%index WHERE c1%'
 --ORDER BY timestamp_
 ),
 t2 AS (
 SELECT
  CASE WHEN t.statement_ LIKE '%wide_index%' THEN 'wide_index' ELSE 'narrow_index' END AS index_width
 ,CASE @fragmented WHEN 'high_frag_level' THEN 'y' ELSE 'n' END AS fragmented
 ,duration_microsec
 ,CASE WHEN t.statement_ LIKE '%wide_index%' THEN @exec_time_wide_index_usec ELSE @exec_time_narrow_index_usec END AS usec_clock
 ,cpu_microsec
 ,physical_reads
 ,logical_reads
 ,CASE WHEN t.statement_ LIKE '%wide_index%' THEN @bp_wide_mb ELSE @bp_narrow_mb END AS mb_cache
 FROM t)
 INSERT INTO measures(rows_to_read, index_width, fragmented, usec_xe, usec_clock, cpu_microsec, physical_reads, logical_reads, mb_cache)
 SELECT @rows_to_read, index_width, fragmented, duration_microsec, usec_clock, cpu_microsec, physical_reads, logical_reads, mb_cache
 FROM t2;
 --Report fragmentation level, if requested
 IF @report_frag = 'y'
     --Note size of index and frag level, should be comparative between executions
     SELECT
       OBJECT_NAME(s.object_id) AS table_name
      ,s.index_type_desc
      ,CAST(s.avg_fragmentation_in_percent AS decimal(5,1)) AS frag_level
      ,s.page_count/1000 AS page_count_1000s
      ,s.index_depth
     FROM sys.dm_db_index_physical_stats(DB_ID(), NULL, NULL, NULL, 'LIMITED')  AS s
     WHERE s.index_level = 0 AND s.alloc_unit_type_desc = 'IN_ROW_DATA' AND OBJECT_NAME(s.object_id) IN('narrow_index', 'wide_index')
     ORDER BY index_id
 GO
 --END of proc that executes our SQL

 --1: Generate fragmentation in both indexes
 --Fragment wide ix
 EXEC #status 'Generate fragmentation in wide index…'
 UPDATE wide_index SET c6 = REPLICATE('a', 200) WHERE c1 % 20 = 0
 UPDATE STATISTICS wide_index WITH FULLSCAN, MAXDOP = 0
 --Fragment narrow ix
 EXEC #status 'Generate fragmentation in narrow index…'
 UPDATE narrow_index SET c2 = REPLICATE('a', 20) WHERE c1 % 100 = 0
 UPDATE STATISTICS narrow_index WITH FULLSCAN, MAXDOP = 0

 --Configure the instance and database
 --Execute this if you want to have a rather full BP, restricts memory to 3 GB
 EXEC sp_configure 'max server memory', 3000 RECONFIGURE
 --Turn off auto-update statistics
 ALTER DATABASE Stackoverflow SET AUTO_UPDATE_STATISTICS OFF
 --Turn off parallelism
 ALTER DATABASE SCOPED CONFIGURATION SET MAXDOP = 1
 --Just for fun, if you want: disable read-ahead (sequential pre-fetch)
 --DBCC TRACEON(652, -1)
 --Run the queries
 DROP TABLE IF EXISTS #myRawXeData
 EXEC #status 'Run queries with high frag level…'
 --EXEC run_the_sql @fragmented = 'high_frag_level', @rows_to_read = 1,        @range_iterations = 100, @fill_bp = 'y', @report_frag = 'y'
 EXEC run_the_sql @fragmented = 'high_frag_level', @rows_to_read = 10000,    @range_iterations = 100, @fill_bp = 'y', @report_frag = 'n'
 EXEC run_the_sql @fragmented = 'high_frag_level', @rows_to_read = 100000,    @range_iterations = 100, @fill_bp = 'y', @report_frag = 'n'

 --2: Defrag the indexes with a fillfactor set to make same size as when fragmented
 EXEC sp_configure 'max server memory', 26357 RECONFIGURE
 EXEC #status 'Eliminate fragmentation in wide index…'
 ALTER INDEX x ON wide_index REBUILD WITH (FILLFACTOR = 48, MAXDOP = 0)
 EXEC #status 'Eliminate fragmentation in narrow index…'
 ALTER INDEX x ON narrow_index REBUILD WITH (FILLFACTOR = 50, MAXDOP = 0)
 EXEC sp_configure 'max server memory', 3000 RECONFIGURE
 --Run the queries
 DROP TABLE IF EXISTS #myRawXeData
 EXEC #status 'Run queries with low frag level…'
 --EXEC run_the_sql @fragmented = 'low_frag_level', @rows_to_read = 1,         @range_iterations = 100, @fill_bp = 'y', @report_frag = 'y'
 EXEC run_the_sql @fragmented = 'low_frag_level', @rows_to_read = 10000,     @range_iterations = 100, @fill_bp = 'y', @report_frag = 'n'
 EXEC run_the_sql @fragmented = 'low_frag_level', @rows_to_read = 100000, @range_iterations = 100, @fill_bp = 'y', @report_frag = 'n'
 -----------------------------------------------------------------------------------
 --Reset configurations
 EXEC sp_configure 'cursor threshold', -1
 EXEC sp_configure 'max server memory', 26357
 RECONFIGURE
 ALTER DATABASE Stackoverflow SET AUTO_UPDATE_STATISTICS ON
 ALTER DATABASE SCOPED CONFIGURATION SET MAXDOP = 0
 DBCC TRACEOFF(652, -1)
 GO
 -----------------------------------------------------------------------------------
 --Run below manually and investigate the output
 --Raw data from the trace
 SELECT * FROM measures ORDER BY rows_to_read, index_width, fragmented
 --Average the data.
 SELECT
  m.rows_to_read
 ,m.index_width
 ,m.fragmented
 --,AVG(m.usec_xe) AS usec_xe
 ,AVG(m.usec_clock) AS usec_clock
 ,AVG(m.mb_cache) AS mb_cache
 ,AVG(m.physical_reads) AS physical_reads
 ,AVG(m.logical_reads) AS logical_reads
 --,AVG(m.cpu_microsec) AS cpu_microsec --I didn't find this relevant, hence the exclusion
 FROM measures AS m
 GROUP BY m.rows_to_read, m.index_width, m.fragmented
 ORDER BY index_width, rows_to_read, fragmented;
 -----------------------------------------------------------------------------------
 --Cleanup
 /*
 DROP TABLE IF EXISTS narrow_index
 DROP TABLE IF EXISTS myXeData
 DROP TABLE IF EXISTS myXeData2
 DROP TABLE IF EXISTS bp_usage
 */
Did you ever consider what the age distribution of your plan cache is? Maybe you should. Here are a couple of examples:
You search for expensive queries
Some of you might be using query store and run queries or use a GUI on top of query store. No problems: the queries, plans and run-time statistics for query store are persisted in your database. (There is the aspect of how you configure query store, but that is a different topic.)
Or some of you are using some tracing mechanism like SQL Trace/Profiler or Extended Events to capture your queries and their costs. Fine, you obviously now work on the data captured in this trace.
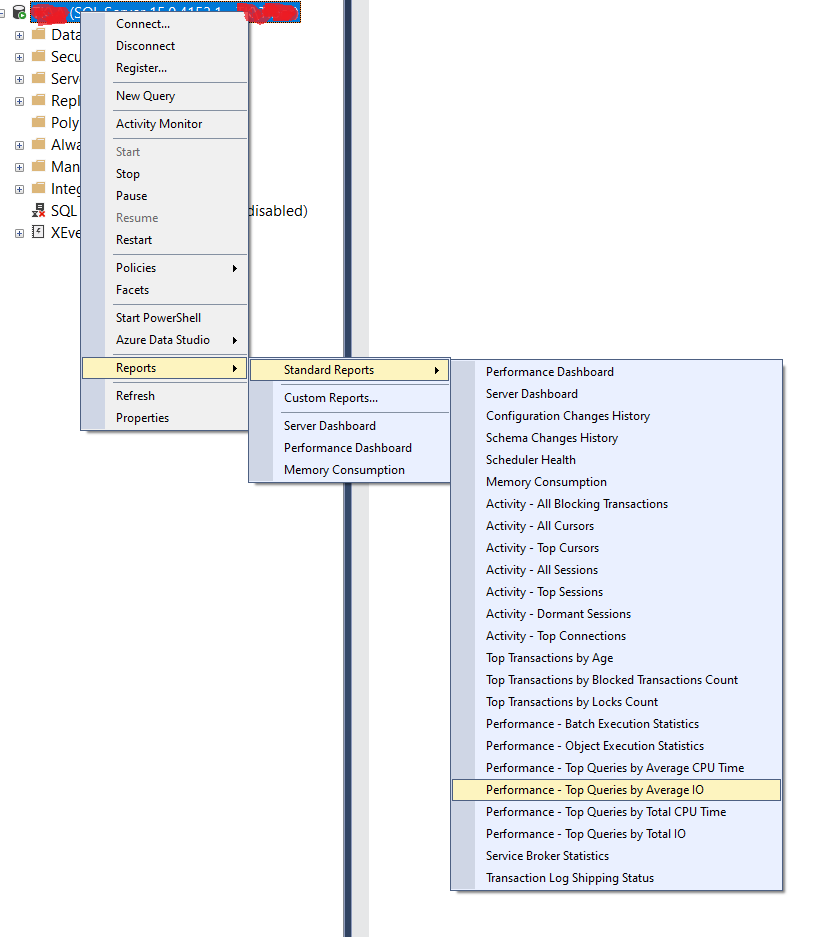
But how about Googling and finding some neat query on the Internet that gives you your most expensive queries? Perfect! It took you 30 seconds to Google it, and 30 more seconds to copy, paste and run that query. Or you use a GUI, for instance in SSMS, something like:
The thing is that these tools/queries uses the plan cache to find expensive queries.
So what if your oldest plan is 3 only days old? Or 3 hours? Or 3 minutes?
Finding your most expensive queries based on such short “tail” is pretty meaningless and you end up wasting time tuning a set of queries that in the end wasn’t the most important ones, after all.
Or you might have some issue with your workload, generating lots and lots of plans.
Did you say ad-hoc queries? You might just want to be aware of that fact, and see if there is anything you can to do about it! Talk to the developers, consider “forced parameterization” database setting, or “optimize for ad-how workloads” server or database setting. Here is a good blog post by Randolph West and Erik Darling on that topic: https://bornsql.ca/blog/dont-optimize-for-ad-hoc-workloads-as-a-best-practice/.
Finding the oldest plan in cache is easy
Search for the oldest plan in cache using sys.dm_exec_query_stats:
SELECT MIN(creation_time)
FROM sys.dm_exec_query_stats;
To get a histogram you can generate a column with how old in minutes/hours/days each plan is and then just use GROUP BY and COUNT. Below I store the age of each query in a temp table and then you can use whichever of the subsequent queries that suits your age distribution best. You probably want to start with the first one to see age distribution in days. If you find that the plans are only a day or two old, then go by hours, and possibly the third one, by minutes.
DROP TABLE IF EXISTS #t
SELECT
 DATEDIFF_BIG(MINUTE, creation_time, GETDATE()) AS minutes_
,DATEDIFF_BIG(HOUR, creation_time, GETDATE()) AS hours_
,DATEDIFF_BIG(DAY, creation_time, GETDATE()) AS days_
INTO #t
FROM sys.dm_exec_query_stats
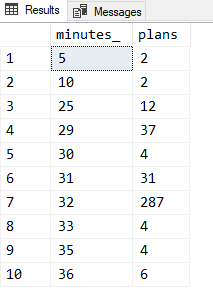
SELECT days_, COUNT(*) AS plans FROM #t GROUP BY days_ ORDER BY days_
SELECT hours_, COUNT(*) AS plans FROM #t GROUP BY hours_ ORDER BY hours_
SELECT minutes_, COUNT(*) AS plans FROM #t GROUP BY minutes_ ORDER BY minutes_
Here’s an example of the result. This is from my machine where I pretty recently cleared the plan cache, using the last query:
Over the last week, I’ve seen two discussions where the securityadmin server role was suggested.
The scenario is typically that we don’t want to make this person a sysadmin, but we want this to manage logins and stuff like that.
The problem, however is that as securityadmin you can create a login and then grant CONTROL SERVER permissions to that login. And having CONTROL SERVER is pretty close to being sysadmin.
First the senior DBA does below:
--The senior DBA, sysadmin, does this
CREATE LOGIN theSecAdmin WITH PASSWORD = 'thePassword'

ALTER SERVER ROLE securityadmin ADD MEMBER theSecAdmin
Then theSecAdmin does:
--Succeeds
CREATE LOGIN theSecAdmin2 WITH PASSWORD = 'thePassword'

--Succeeds!!!
GRANT CONTROL SERVER TO theSecAdmin2
Now theSecAdmin2 can do pretty much anything in the SQL Server, including use all database and whatnot.
There *are* some important differences between being a sysadmin and having CONTROL SERVER, but I’ll save that for another day.
Microsoft are in the process of killing MSDN and TechNet forums.
I’ve been doing these for some 10 years now. Prior to that we had newsgroup forums (NNTP).
So, where to we go?
Lately, I’ve been participating in the Stack Exchange SQL Server community. Yes, this is under the same umbrella where also the famous Stack Overflow lives. Not strictly a forum, you might say, but IMO it serves pretty much the same purpose. People having issues with SQL Server and want help and feedback. Here are the SQL Server related stuff on DBA.SE: https://dba.stackexchange.com/questions/tagged/sql-server .
I find that on SE, we are more encouraged to edit answers so an answer can be a reference for the future. I.e., more like a database of issues and answers. I like that idea, even though it takes a little while to get used to. Especially editing somebody else’s answer – it feels a bit impolite! 🙂
But what about the Microsoft hosted forums? They have been moved to Microsoft Q&A, which lives under Microsoft Docs.
Well, not strictly “moved” since this is an all new platform. We used to have a couple of dozens of SQL Server forums on MSDN/TechNet. MS has apparently decided that less is more and on the SQL Server Q&A, we only have 5 sub-sections.
Have you ever experienced a sudden jump an identity column in SQL Server? Yeah, SQL Server caches the identity values and if you have a hard shutdown, you have consumed a number of values from that cache.
Should you care about the gap? In most cases: no. The identity value should be meaningless. In many cases I think that it is just an aesthetic issue to not have these gaps. (I’ve seen cases where you do run into problems because of the gap, I should add – but not frequently.)
For the SEQUENCE object, we have the CACHE option to specify how many values to cache. I.e., max values we can jump if we have a hard shutdown.
For identity, we have the IDENTITY CACHE database scoped configuration, introduced in SQL Server 2017. Caching on or off. On is default. We also have trace flag 272, at the instance level.
However, disabling the caching isn’t free. I’ve seen numerous posts on disabling the cache and not getting gaps. But I didn’t find any elaboration on performance. Hence this article. If you’ve done performance testing for this or know about such article, please leave a comment!
The problem is as always how to set up a realistic test case. What would the typical table structure and insert pattern look like? How long is a piece of string? So I decided to skip that part and go for the most simplified case I could:
A table with an identity columns and one more int column. (The reason for that second column is to hopefully avoid any special handling for identity-only tables in SQL Server.) The insert is an insert with a subselect. I.e., all rows in one transaction.
You know this already: your mileage will vary!
Anyhow, for my test, I consistently had about 5 times better performance with identity caching turned on. IMO, this is at least enough to show that caching identity values *can* be have performance aspect to; not turn it off “just because”.
--Test performance penalty for lowering identity cache
SET NOCOUNT ON
USE master

DROP DATABASE IF EXISTS Identity_test
GO

CREATE DATABASE Identity_test
 ON  PRIMARY
( NAME = N'Identity_test', FILENAME = N'C:\DemoDatabases\DbFiles\a\Identity_test.mdf' , SIZE = 500MB , MAXSIZE = UNLIMITED, FILEGROWTH = 64MB )
 LOG ON
( NAME = N'Identity_test_log', FILENAME = N'C:\DemoDatabases\DbFiles\a\Identity_test_log.ldf' , SIZE = 500MB , MAXSIZE = 2048GB , FILEGROWTH = 64MB )
GO

USE Identity_test
DROP TABLE IF EXISTS t

--Our identity table
CREATE TABLE t(c1 int IDENTITY(1,1), c2 int)

--Where we will log execution times
CREATE TABLE timing(run int, descr varchar(50), ms int)


ALTER DATABASE SCOPED CONFIGURATION SET IDENTITY_CACHE = ON
GO
WAITFOR DELAY '00:00:01'
GO
DECLARE @a time(7) = SYSDATETIME()
INSERT INTO t
SELECT TOP(1000000) 1 FROM sys.columns AS a CROSS JOIN sys.columns AS b
INSERT INTO timing (run, descr, ms)
VALUES(1, 'Cache on', DATEDIFF(ms, @a, CAST(SYSDATETIME() AS time(7))))
TRUNCATE TABLE t
GO

WAITFOR DELAY '00:00:01'
GO

ALTER DATABASE SCOPED CONFIGURATION SET IDENTITY_CACHE = OFF
GO
WAITFOR DELAY '00:00:01'
GO
DECLARE @a time(7) = SYSDATETIME()
INSERT INTO t
SELECT TOP(1000000) 1 FROM sys.columns AS a CROSS JOIN sys.columns AS b
INSERT INTO timing (run, descr, ms)
VALUES(2, 'Cache off', DATEDIFF(ms, @a, CAST(SYSDATETIME() AS time(7))))
TRUNCATE TABLE t
GO


ALTER DATABASE SCOPED CONFIGURATION SET IDENTITY_CACHE = ON
GO
WAITFOR DELAY '00:00:01'
GO
DECLARE @a time(7) = SYSDATETIME()
INSERT INTO t
SELECT TOP(1000000) 1 FROM sys.columns AS a CROSS JOIN sys.columns AS b
INSERT INTO timing (run, descr, ms)
VALUES(3, 'Cache on', DATEDIFF(ms, @a, CAST(SYSDATETIME() AS time(7))))
TRUNCATE TABLE t
GO

WAITFOR DELAY '00:00:01'
GO

ALTER DATABASE SCOPED CONFIGURATION SET IDENTITY_CACHE = OFF
GO
WAITFOR DELAY '00:00:01'
GO
DECLARE @a time(7) = SYSDATETIME()
INSERT INTO t
SELECT TOP(1000000) 1 FROM sys.columns AS a CROSS JOIN sys.columns AS b
INSERT INTO timing (run, descr, ms)
VALUES(4, 'Cache off', DATEDIFF(ms, @a, CAST(SYSDATETIME() AS time(7))))
TRUNCATE TABLE t
GO


ALTER DATABASE SCOPED CONFIGURATION SET IDENTITY_CACHE = ON
GO
WAITFOR DELAY '00:00:01'
GO
DECLARE @a time(7) = SYSDATETIME()
INSERT INTO t
SELECT TOP(1000000) 1 FROM sys.columns AS a CROSS JOIN sys.columns AS b
INSERT INTO timing (run, descr, ms)
VALUES(5, 'Cache on', DATEDIFF(ms, @a, CAST(SYSDATETIME() AS time(7))))
TRUNCATE TABLE t
GO

WAITFOR DELAY '00:00:01'
GO

ALTER DATABASE SCOPED CONFIGURATION SET IDENTITY_CACHE = OFF
GO
WAITFOR DELAY '00:00:01'
GO
DECLARE @a time(7) = SYSDATETIME()
INSERT INTO t
SELECT TOP(1000000) 1 FROM sys.columns AS a CROSS JOIN sys.columns AS b
INSERT INTO timing (run, descr, ms)
VALUES(6, 'Cache off', DATEDIFF(ms, @a, CAST(SYSDATETIME() AS time(7))))
--TRUNCATE TABLE t
GO


--Result?
SELECT * FROM timing ORDER BY run

SELECT
 AVG(CASE descr WHEN 'cache on' THEN ms ELSE NULL END) AS cache_on
,AVG(CASE descr WHEN 'cache off' THEN ms ELSE NULL END) AS cache_off
,CAST(
   CAST(AVG(CASE descr WHEN 'cache off' THEN ms ELSE NULL END) AS decimal(9,2)) /
   AVG(CASE descr WHEN 'cache on' THEN ms ELSE NULL END)
  AS decimal(9,2)) AS ratio
FROM timing
Duh, it’s on the web, you say. Yes, of course it is, but sometimes you prefer to have a local copy of the documentation. For instance:
You are behind a firewall. Yes, you might be sitting on a jumpbox or even the server without access to Internet and need the documentation.
You want instant overview of contents. Ever tried to see what the contents for the help is on the web-based help? Yeah, in the end you rely on Google. Sometimes you just want to have an immediate response when you navigate the contents, from the root to the leaf.
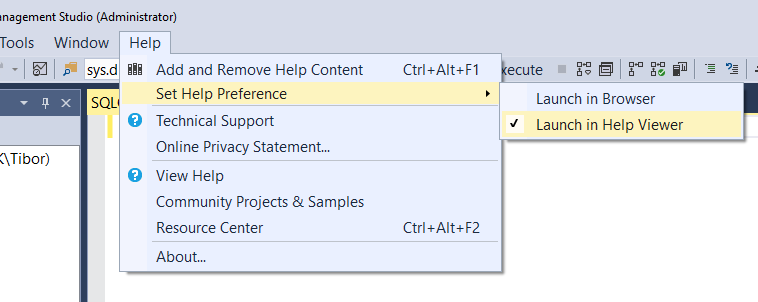
First of all, you have two options in SSMS for the F1-help: Web-based or local (which means the Help Viewer tool). Web-based is default, so we don’t need to dive further into that.
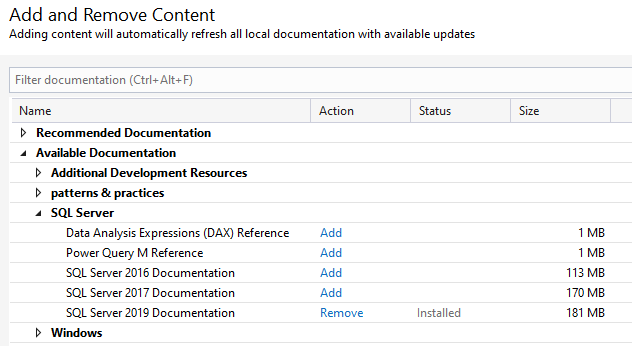
But you will now notice that you don’t have any contents. So, do “Add and Remove Help Content”. I have imploded all but the SQL server books below:
Just “Add” it and then press the “Update” button on the lower right of the window.
How do I get to the help?
You can do F1 from a query window. Type for instance SELECT, mark the word and press F1. Many keywords and such has entries into the help to get you to the right place immediately. Just like the web-based help.
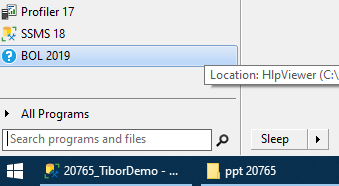
Another option is to create a shortcut for the help. I use the Classic Start Menu tool (how can you else use windows?) and I have a shortcut for the help, named “BOL 2019”.
The tricky part is what to point to. Here is what I have
Start in: “C:\Program Files (x86)\Microsoft Help Viewer\v2.3” Target: “C:\Program Files (x86)\Microsoft Help Viewer\v2.3\HlpViewer.exe” /catalogName SSMS18 /locale en-US
Tips
You can switch what F1 does in SSMS at any time. So even if you have downloaded the books, but you now want F1 to take you to the web-based help, then just switch to that.
The local help has an entry at the right top to take you to the webpage when you have some page open.
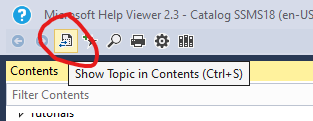
When you have found a page in the local help, be it from F1, the index or a search, you sometimes want to “know where you are”. I.e., see the contents and surrounding topics etc:
In my earlier blog post, I focused on scalar functions that performs I/O, meaning they have at least one SELECT. For this post, I will focus on the opposite.
I have seen plenty of cases where functions just concatenate two or three strings, possibly substituting NULL with an empty string. Or doing simple arithmetic. In other languages, that might be just fine – the function is compiled in such a way that the performance difference between in-lining that expression and calling the function is minuscule. But not in SQL server! At least not until SQL server 2019.
The point here is that there has been a significant overhead of just calling the function. And since SQL is set-based, the function can be called many many times in just one statement (a SELECT, for instance).
The example
I’m using the AdventureworksDW database, and the FactResellerSalesXL_CCI table, which has approx 11,000,000 rows. I’m using the one with a clustered columnstore index, which is about 0.48 GB.
We are going to calculate the average UnitPrice, including VAT (which in Sweden is 25%).
The UDF
CREATE OR ALTER FUNCTION addVAT (@v money)
RETURNS money
AS
BEGIN
    RETURN @v * 1.25
END
GO
The queries
We will calculate average price including VAT for all approx 11 million rows. The queries that call the UDF will be executed with both UDF inlining turned off and on. See my earlier blog post for turning UDF inlining on/off.
-- Q1 With scalar function, called for each row
SELECT SUM(dbo.addVAT(Unitprice)) FROM FactResellerSalesXL_CCI
GO

-- Q2 In-line the expression
SELECT SUM(Unitprice * 1.25) FROM FactResellerSalesXL_CCI
GO

-- Q3 Call the UDF only once
SELECT dbo.addVAT(SUM(Unitprice)) FROM FactResellerSalesXL_CCI
GO

-- Q4 In-line the expression and calculate only once
SELECT (SUM(Unitprice)) * 1.25 FROM FactResellerSalesXL_CCI
GO
The result
Query
Expression called
UDF Inlining
Duration ms
CPU ms
Q1
many times
N
38,100
30,900
Q1
many times
Y
960
970
Q2
many times
510
510
Q3
once
N
21
16 or 32
Q3
once
Y
21
16 or 32
Q4
once
21
16 or 32
Conclusion
First I want to remind you that we call this function many times: 11 million times. Keep that in mind. But also keep in mind that scalar functions prohibit parallelism, unless they are inlined in 2019.
Note that measuring CPU seems to be in some type of quanta. We seem to get a multiple of 16 ms, or close to that. You might have seen this before, possibly from SET STATISTICS TIME or a trace. Not really relevant to the discussion, just an observation.
Anyhow, as you can see, the cost of calling an UDF can be significant. The savings with SQL server inlining it for us can be drastic. As good as not having it in the first place? No, not really but still a potential for a hefty saving.
And, less stupid code is always better!
Disclaimer
If you look closely enough at the result, you will see that there is a slight difference between the result from some of the queries. It isn’t until the 8:th digit, though. And, more importantly: it is beside the point.