This post is not about how to use the Activity Monitor (AM) tool in SQL Server Management Studio (SSMS) – there are loads of such posts written already. Also, it is not about dissing AM, you will find such posts as well.
What I want to do is to explain the information in AM, for instance what time span the information covers. I see lots of confusion about this, and incorrect assumptions can be made because of that. This aspect is typically not mentioned in other blog posts on AM that I have seen.
The SQL Server documentation is very vague on the topic. In fact, the most recent documentation article explaining the information in AM that I found is for SQL Server 2008 R2. And that documentation is at many places vague, or even flat out incorrect. For more recent versions of SQL Server, there’s not even an attempt to explain the information. (Please let me know if you find such official articles.)
I know that lots of people uses the Activity Monitor tool in SQL Server, especially the less experienced DBA. The more experienced DBA often uses other tools like Adam Machanic‘s sp_whoisactive (see this and this) , Brent Ozar’s sp_BlitzFirst, etc.
Say for instance that you had massive amount of I/O for one of your databases for the last day, up until a minute ago. I.e., the I/O load for the database varies a bit, but on average is very high. You look in AM which show this database as silent since you happened to have low I/O the last minute, and AM show some other database as being the one with high load.
So, we need to think about the time dimension here. AM does a refresh at certain intervals. By default it is every 10 seconds, but you can change that by right-clicking somewhere in AM and change in that context menu. Keep this in mind. It is important. We will refer to it as the most recent refresh interval, or snapshot.
I’m using SQL Server Management Studio (SSMS) 2016, and SQL Server 2016. It is possible that other version combination does other things. With the information in this blog post, you will be able to find and determine that for yourself. Please comment if you find important deviations, or perhaps just confirmations (like “SSMS 2012 does the same thing”).
I mainly used tracing to spy on the SQL submitted by AM.
The four top graphs:
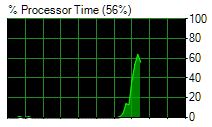
“% Processor Time” is picked up directly from the OS (using WMI, I believe). Most probably a Performance Monitor counter in the end.
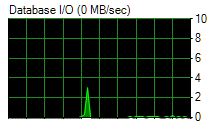
“Database I/O” is the sum of I/O for all database files performed since the last snapshot. This is fine since we intuitively understand that, because we have the trail of prior snapshot values displayed in the graph. The information comes from sys.dm_io_virtual_file_stats, doing a SUM over num_of_bytes_read + num_of_bytes_written, converted to MB.
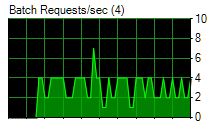
“Batch Requests/sec” is the number of batches we have submitted to our SQL Server since the last snapshot. Again, this is pretty intuitive since we have a trail of snapshot values in the graph. The information is from the performance counter “Batch Requests/sec” picked up from sys.sysperfinfo (bad Microsoft, you should use sys.dm_os_performance_counters 🙂 ).
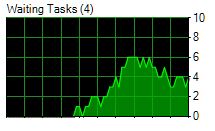
“Waiting Tasks” show how many that are waiting for something (a lock to be released, for instance). This is not as straight-forward as the others. The information comes from sys.dm_os_wait_stats UNION ALL with sys.dm_os_waiting_tasks.
The values are compared to those from the prior snapshot. However, a higher weight in that calculation will be given to the prior snapshot values if you have a short refresh interval. Say that you have a 1-second refresh interval. Then only a weight of 9% is from the current interval and 91% is from the prior interval. Since the current interval value will become the prior value for the next snapshot, a “trail” is kept back in time with a diminishing weight the longer back in time you go.
If you refresh every 10 seconds, then current interval weight is 60% and previous interval weight is 40%. It pretty quickly approaches 100% for current snapshot the longer refresh interval you are using. Hats off to Microsoft for so clearly documenting this in the temporary stored procedures that AM is using. It is in the source code, all you need to do is to grab it in a trace and read it. The name of the procedure is #am_generate_waitstats, and it is created when you open the AM window in SSMS.
Note that not all wait types are represented here. See the section below named ‘The “Resource Waits” pane’ for more information. The “Waiting Tasks” diagram and the “Resource Waits” pane shares some T-SQL code.
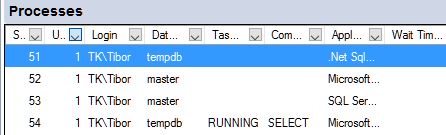
The “Processes” pane
This is pretty straight forward so I won’t spend much time on it here. It shows information about the sessions you have at the moment the snapshot is produced. It uses a query joining DMVs such as sys.dm_exec_sessions, sys.dm_exec_requests, sys.dm_os_tasks, etc. Go grab the query in a trace and paste into a query window if you want to dig into it.
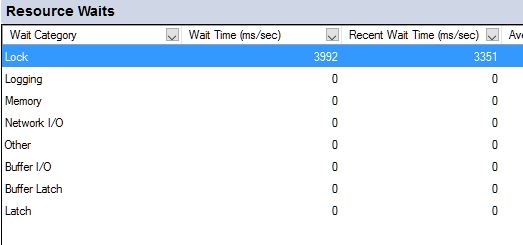
The “Resource Waits” pane
The idea here is to show where SQL Server is waiting, “wait stats”.
It uses the same procedure as the “Waiting Tasks” diagram uses, #am_generate_waitstats, to get the information. See the above section for “Waiting Tasks” to understand the time dimension for this. For simplicity, we can say that it shows only wait stats for the past 30-60 seconds. This is important. Imagine that you had loads of a certain wait stats, but none just for the last minute. This pane can now fool you that you didn’t have any waits of that kind, just because you didn’t for the past minute. Note, though, that the “Cumulative Wait Time” column is the sum of wait in the group since SQL Server was re-started or since we last cleared the wait state (DBCC SQLPERF(“sys.dm_os_wait_stats”,CLEAR)).
In an attempt to be friendly, it will group and summarize wait stats into various groups. That would be fine if there were some documentation about which individual wait type is in each group. Also, some wait types are ignored. One of the ignored wait types is CXPACKET, another is THREADPOOL.
AM creates a table named #am_wait_types when you open the AM window, which it populates with various wait types and the group each wait stats is in. This table has a column named “ignore”. The two wait types I mentioned above has 1 in this “ignore” column. There are 35 rows which has 1 for the “ignore” column. To be fair, most are benign but the two which I immediately reacted on are the ones I mentioned above.
But hang on, how many rows do we have in this #am_wait_types table in total? The answer is 263. Are there more than 263 wait types in 2016? You bet! I did a select from sys.dm_os_wait_stats and I got 875 rows. So, 633 of the wait types in 2016 are not at all considered by AM. That of course begs the question whether I found any interesting wait types that aren’t in #am_wait_types? I didn’t go through them all, but I glanced only quickly and for instance SOS_SCHEDULER_YIELD caught my attention. If you want to go through them, then I highly recommend Paul Randal’s wait types library. If you find anything that stands out, then please post a comment.
SELECT ws.wait_type FROM sys.dm_os_wait_stats AS ws
WHERE ws.wait_type NOT IN(
SELECT wt.wait_type FROM #am_wait_types AS wt WHERE wt.ignore = 0
)
ORDER BY wait_type

The “Data File I/O” pane
This shows I/O activity per database file since the last snapshot. Again, you could for instance have had lots of I/O for a database the last day, but if it was silent the past minute, then this dialog will potentially mislead you.
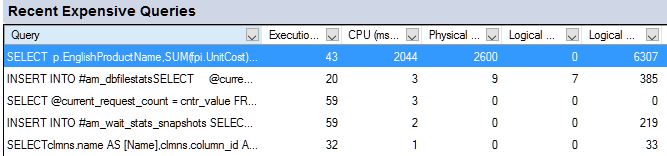
The “Recent Expensive Queries” pane
This shows the most expensive queries, based on what column you sort on, executed since the last snapshot. If you have, say, a 10 second snapshot interval, you will only see the queries executed during these 10 seconds. AM uses a procedure named #am_get_querystats to collect the information. There are a few things going on inside this procedure, but at the most basic level, it uses sys.dm_exec_query_stats and sys.dm_exec_requests to get queries from cache and currently executing queries. It then does some processing and store the result in temp tables so we later can sort on different columns depending on what metric we are interested in. I suggest that you spend some time with the source code if you want to dig deeper.
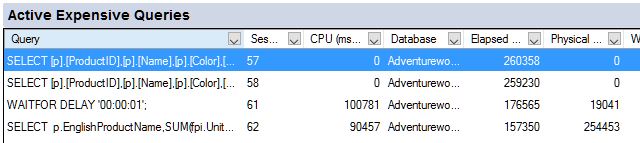
The “Active Expensive Queries” pane
This is very straight forward. It executes a query which uses sys.dm_exec_requests joined to a few other DMVs.
How to dig deeper
I thought about including snippets of AM’s source code, the list of wait stats grouping etc here. But I decided against that. It would litter this post, and the code might differ between releases and builds of SSMS. So, if you are interested in digging deeper, fire up your favorite trace tool (Extended Events, Profiler, Server-side trace, …) and catch the SQL submitted by AM.
When you open the AM window, it executes a few batches that creates procedures and tables that it will later use for each refresh interval. Here are the ones that I found:
- The table #am_wait_types, which contains the wait types that AM bothers about, along with the grouping and which of those that are ignored. This is the one you want to investigate to see which wait types that are ignores by AM; either having 1 in the “ignore” column, or by not being in that table in the first place. Match against sys.dm_os_wait_stats.
- The procedure #am_generate_waitstats which collects wait stats with some trail back in time, as explained above.
- The table #am_dbfileio in which file I/O stats is stored.
- The tables #am_request_countand and #am_fingerprint_stats_snapshots, used for query statistics.
- The procedure #am_get_querystats, which collects and stores the query statistics.
At each refresh interval, you see 4 T-SQL batches submitted for the top 3 graphs that are T-SQL based (ignoring the “dead” graph that I have in SSMS 2016, and also ignoring “% Processor Time” since it is WMI-based).
If you have expanded the “Processes” pane, you also see a batch that collects that information at every refresh interval.
If you have expanded the “Resource waits” pane, you also see a batch that does a SELECT from the #am_resource_mon_snap table at every refresh interval, with grouping and SUM based on resource type.
If you have expanded the “Data File I/O” pane, you also see a batch that collects that information at every refresh interval.
If you have expanded the “Recent Expensive Queries” pane, you also see a batch that executes the #am_get_querystats procedure to collects that information. It is executed at refresh intervals, but not necessarily at every refresh interval. Check the source code for the procedure and you see that SM will execute this no more frequently than every 15 seconds.
If you have expanded the “Active Expensive Queries” pane, you also see a batch that executes a query to collects that information. It seems to be limited so it doesn’t execute more frequently than every 5 seconds (even with a shorter refresh interval).
The bottom line
As always, with understanding of the data we see, we have a chance to make information out of it. The Activity Monitor certainly has its quirks, but if you do feel like using a GUI for these type of things, I hope that you are better equipped now to interpret what it is you are seeing. Personally, I find “Resource Waits”, “Data File I/O” and “Recent Expensive Queries” less useful because of the time dimension handling. As for expensive queries, IMO nothing beats the Query Store in SQL Server 2016.

